
GitHub Outages, Day by Day: A GitHub-Style Activity Calendar
GitHub is famous for the green contribution calendar on every developer profile.
I wanted to see what would happen if I used the same visual language for something completely different:
GitHub incidents.
So I collected incident data from GitHub Status and turned it into a GitHub-style activity calendar.
Instead of showing commits, every square represents a day. Gray means no incident started on that day. Green means one or more incidents started, and darker green means more incident activity.
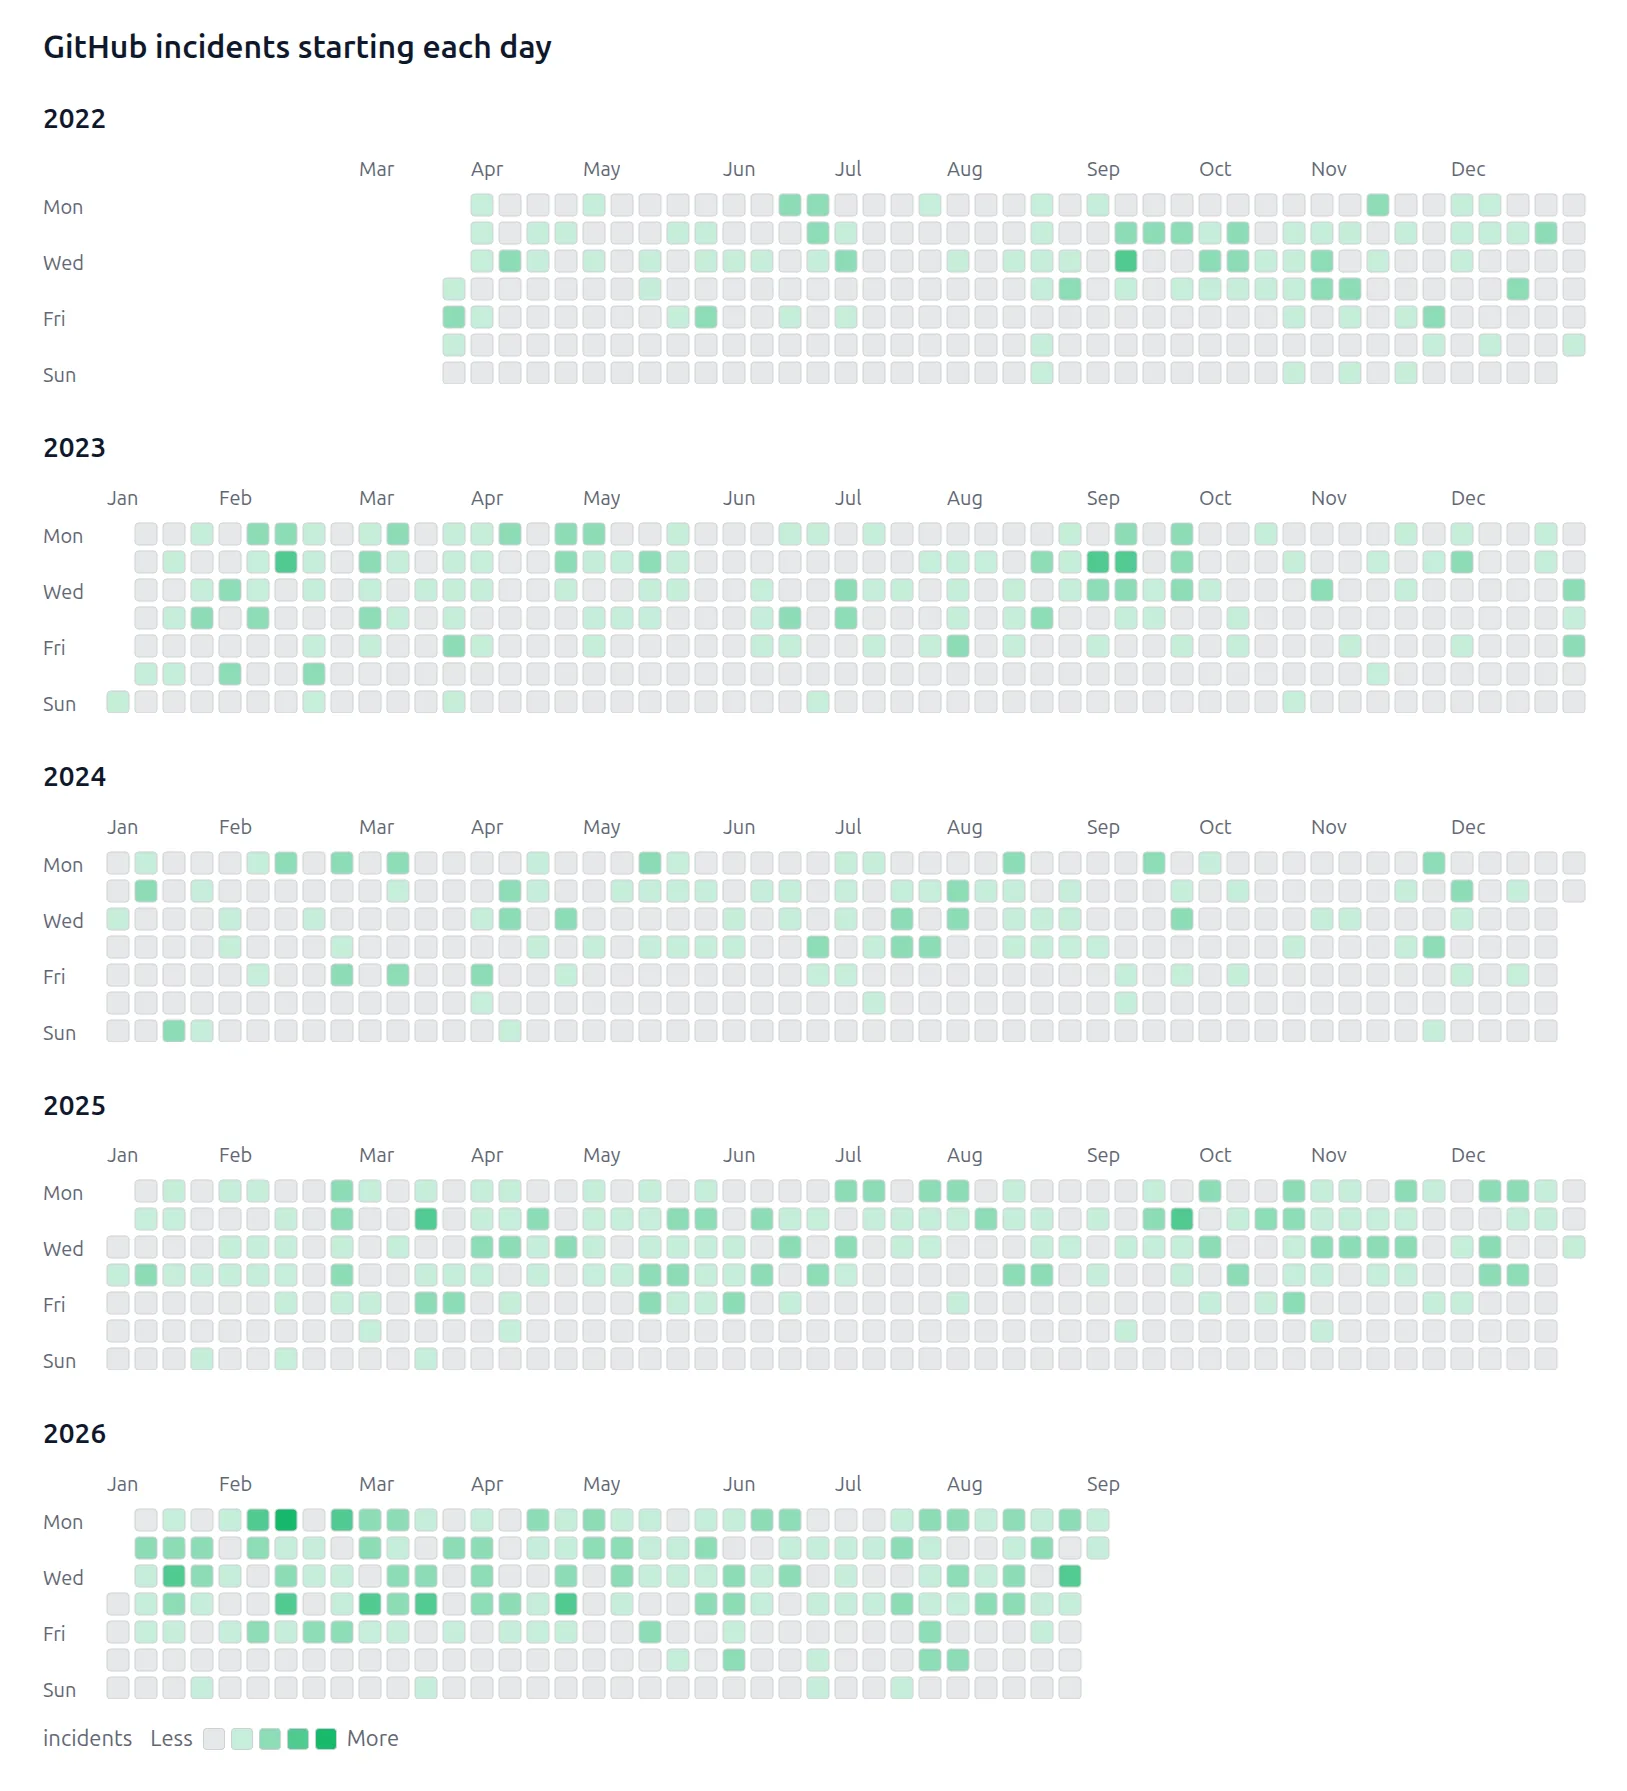
This article explains where the data comes from, how to fetch recent GitHub incidents with Python, how to calculate incident duration with pandas, and how to build the calendar yourself. We will then add interactive filters and publish the Jupyter Notebook as a web app with Mercury.
You can also skip ahead and:
- open the interactive GitHub incidents app, or
- browse the complete notebook and project files on GitHub.
What does the GitHub outage history show?
The calendar covers incident records from March 2022 through September 2026. It compresses more than four years into one view without losing the individual days.
The screenshot was generated from data through September 1, 2026. For that date range, the application reports:
- 829 incidents,
- 3,292.2 hours of total incident duration, and
- 575 days with at least one incident.
The calendar makes the distribution easier to understand than a long incident table. You can see quiet intervals, clusters of activity, and how frequently incidents appeared in different years.
There is also an important caveat: incident duration is not the same as complete GitHub downtime.
An incident can affect only one part of GitHub, such as Actions, API Requests, Pull Requests, Codespaces, Packages, or Copilot. Multiple incidents can also overlap. Adding their durations gives the total duration of the incident records, not the number of hours during which all of GitHub was unavailable.
That is why the application says total incident duration, not “GitHub was down for 3,292 hours.”
Where does the GitHub incident data come from?
GitHub publishes current service information at GitHub Status. Its public Status API includes endpoints for the current status, components, unresolved incidents, scheduled maintenance, and recent incidents.
The recent-incidents endpoint is:
https://www.githubstatus.com/api/v2/incidents.json
At the time of writing, this endpoint returns the 50 most recent incidents. That makes it useful for learning the API or building a recent-status report, but it is not enough for a calendar spanning several years.
For the 2022–2026 visualization, I use the mrshu/github-statuses project. It is an independent historical mirror that reconstructs incident timelines from GitHub Status feed history and publishes the parsed records as reusable files.
The complete application downloads this file:
https://raw.githubusercontent.com/mrshu/github-statuses/refs/heads/master/parsed/downtime_windows.csv
In other words:
| Dataset | Best use | Limitation |
|---|---|---|
| Official GitHub Status API | Recent incidents and live status tools | The incidents endpoint returns only the latest 50 records |
mrshu/github-statuses archive | Multi-year analysis and historical visualizations | It is an unofficial reconstruction of GitHub Status data |
We will start with the official API because it provides the simplest introduction. Then we will switch to the historical CSV for the full calendar.
Fetch recent GitHub incidents with Python
Install the packages used in this tutorial:
pip install requests pandas mercury
Now request the recent incidents from the official GitHub Status API:
import requests

url = "https://www.githubstatus.com/api/v2/incidents.json"

response = requests.get(url, timeout=30)
response.raise_for_status()

data = response.json()
incidents = data["incidents"]
raise_for_status() raises an exception if the request fails instead of allowing the notebook to continue with an invalid response.
The incidents variable is now a Python list. Each item contains fields such as the incident name, impact, status, creation time, resolution time, and affected components.
Convert incidents to a pandas DataFrame
Turn the list into a DataFrame and convert the API timestamps to timezone-aware pandas values:
import pandas as pd

df = pd.DataFrame(incidents)

df["created_at"] = pd.to_datetime(df["created_at"], utc=True)
df["resolved_at"] = pd.to_datetime(df["resolved_at"], utc=True)
Some recent incidents might still be open and therefore have no resolved_at value. Pandas represents those missing timestamps as NaT.
We can calculate the duration of resolved incidents in hours:
df["duration_hours"] = (
    df["resolved_at"] - df["created_at"]
).dt.total_seconds() / 3600

df["date"] = df["created_at"].dt.tz_convert(None).dt.normalize()
Normalizing the timestamp removes the time while keeping a pandas datetime value. Every incident is now assigned to the day on which its GitHub Status record was created.
Aggregate the data by day
An activity calendar needs one row per day. The API can contain several incidents created on the same day, so we must aggregate the records before drawing the calendar.
daily = (
    df.groupby("date", as_index=False)
      .agg(
          incident_count=("id", "count"),
          duration_hours=("duration_hours", "sum"),
      )
)
The result contains three columns:
date— the calendar date,incident_count— how many incidents were created that day,duration_hours— the sum of their resolved durations.
This aggregation is important because Mercury's ActivityCalendar expects one value for each date. It intentionally does not decide how duplicate dates should be combined.
Create a GitHub-style activity calendar in Python
Once the daily data is ready, the visualization needs only a few lines:
import mercury as mr

mr.ActivityCalendar(
    daily,
    date="date",
    value="incident_count",
    title="GitHub incidents starting each day",
    unit="incidents",
    color="green",
)
Mercury draws one square for every day. Dates missing from daily appear as inactive squares, while days with incidents use progressively stronger color intensity.
If the selected range contains several years, ActivityCalendar automatically creates a separate calendar for each year. You can also change the color or hide the month labels, weekday labels, and legend. The complete set of options is available in the ActivityCalendar documentation.
Load the complete GitHub incident history
The previous example uses only the latest incidents. To reproduce the multi-year visualization, load the parsed historical dataset:
import pandas as pd

CSV_URL = (
    "https://raw.githubusercontent.com/mrshu/github-statuses/"
    "refs/heads/master/parsed/downtime_windows.csv"
)

incidents = pd.read_csv(CSV_URL)

incidents["start"] = pd.to_datetime(
    incidents["downtime_start"], utc=True
)
incidents["end"] = pd.to_datetime(
    incidents["downtime_end"], utc=True
)
incidents["date"] = (
    incidents["start"].dt.tz_convert(None).dt.normalize()
)
incidents["duration_hours"] = (
    incidents["duration_minutes"].fillna(0) / 60
)
The notebook assigns an incident's full duration to the date on which that incident started. This produces one clear daily measure, but it does not spread a long incident across every calendar day it touched.
Now aggregate the complete history:
daily = (
    incidents.groupby("date")
    .size()
    .rename("value")
    .reset_index()
)
And display it:
mr.ActivityCalendar(
    daily,
    date="date",
    value="value",
    title="GitHub incidents starting each day",
    unit="incidents",
    color="green",
)
You now have the static multi-year calendar from the beginning of the article.
Add a metric selector
The number of incidents and their total duration answer different questions. A day with one long incident can have more operational impact than a day with several short incidents.
Add a selector so the reader can switch between the two metrics:
metric = mr.Select(
    label="Calendar metric",
    value="Incident count",
    choices=[
        "Incident count",
        "Duration (hours)",
    ],
)
Every Mercury input widget exposes the current selection through its .value attribute. We can use it in ordinary pandas code:
if metric.value == "Incident count":
    daily = (
        filtered.groupby("date")
        .size()
        .rename("value")
        .reset_index()
    )
    calendar_title = "GitHub incidents starting each day"
    calendar_unit = "incidents"
else:
    daily = (
        filtered.groupby("date", as_index=False)["duration_hours"]
        .sum()
        .rename(columns={"duration_hours": "value"})
    )
    calendar_title = "Duration of GitHub incidents starting each day"
    calendar_unit = "hours"
Pass those variables to the calendar:
mr.ActivityCalendar(
    daily,
    date="date",
    value="value",
    title=calendar_title,
    unit=calendar_unit,
    color="green",
)
When someone changes the selector in the web app, Mercury reruns the relevant notebook cells and redraws the calendar.
Filter incidents by date and impact
We can use the same pattern to add a date range and impact filter:
first_date = incidents["date"].min().date().isoformat()
last_date = incidents["date"].max().date().isoformat()

date_range = mr.DateRange(
    label="Incident date range",
    value=[first_date, last_date],
    min=first_date,
    max=last_date,
)

impact = mr.Select(
    label="Impact",
    value="All",
    choices=[
        "All",
        *sorted(incidents["impact"].dropna().unique()),
    ],
)
Apply both selections with pandas:
selected_start = pd.Timestamp(date_range.value[0] or first_date)
selected_end = pd.Timestamp(date_range.value[1] or last_date)

filtered = incidents[
    incidents["date"].between(selected_start, selected_end)
].copy()

if impact.value != "All":
    filtered = filtered[filtered["impact"] == impact.value]
The complete example also extracts component names from historical incident titles and adds a component selector. This lets you focus on records mentioning services such as Actions, API Requests, Pull Requests, or Codespaces. You can see the extraction function in the source notebook.
Add summary indicators
Before the calendar, display three numbers that summarize the current selection:
mr.Indicator([
    mr.Indicator(
        len(filtered),
        label="Filtered incidents",
    ),
    mr.Indicator(
        f"{filtered['duration_hours'].sum():,.1f}",
        label="Total duration (hours)",
    ),
    mr.Indicator(
        filtered["date"].nunique(),
        label="Days with incidents",
    ),
])
These values also update whenever a filter changes. They provide useful context for the calendar without implying that every incident was a complete platform outage.
Turn the Jupyter Notebook into a web app
The final application combines:
- a date-range picker,
- an incident-impact selector,
- a GitHub-component selector,
- a calendar-metric selector,
- a color selector,
- three summary indicators,
- the activity calendar,
- and a table of incident details.
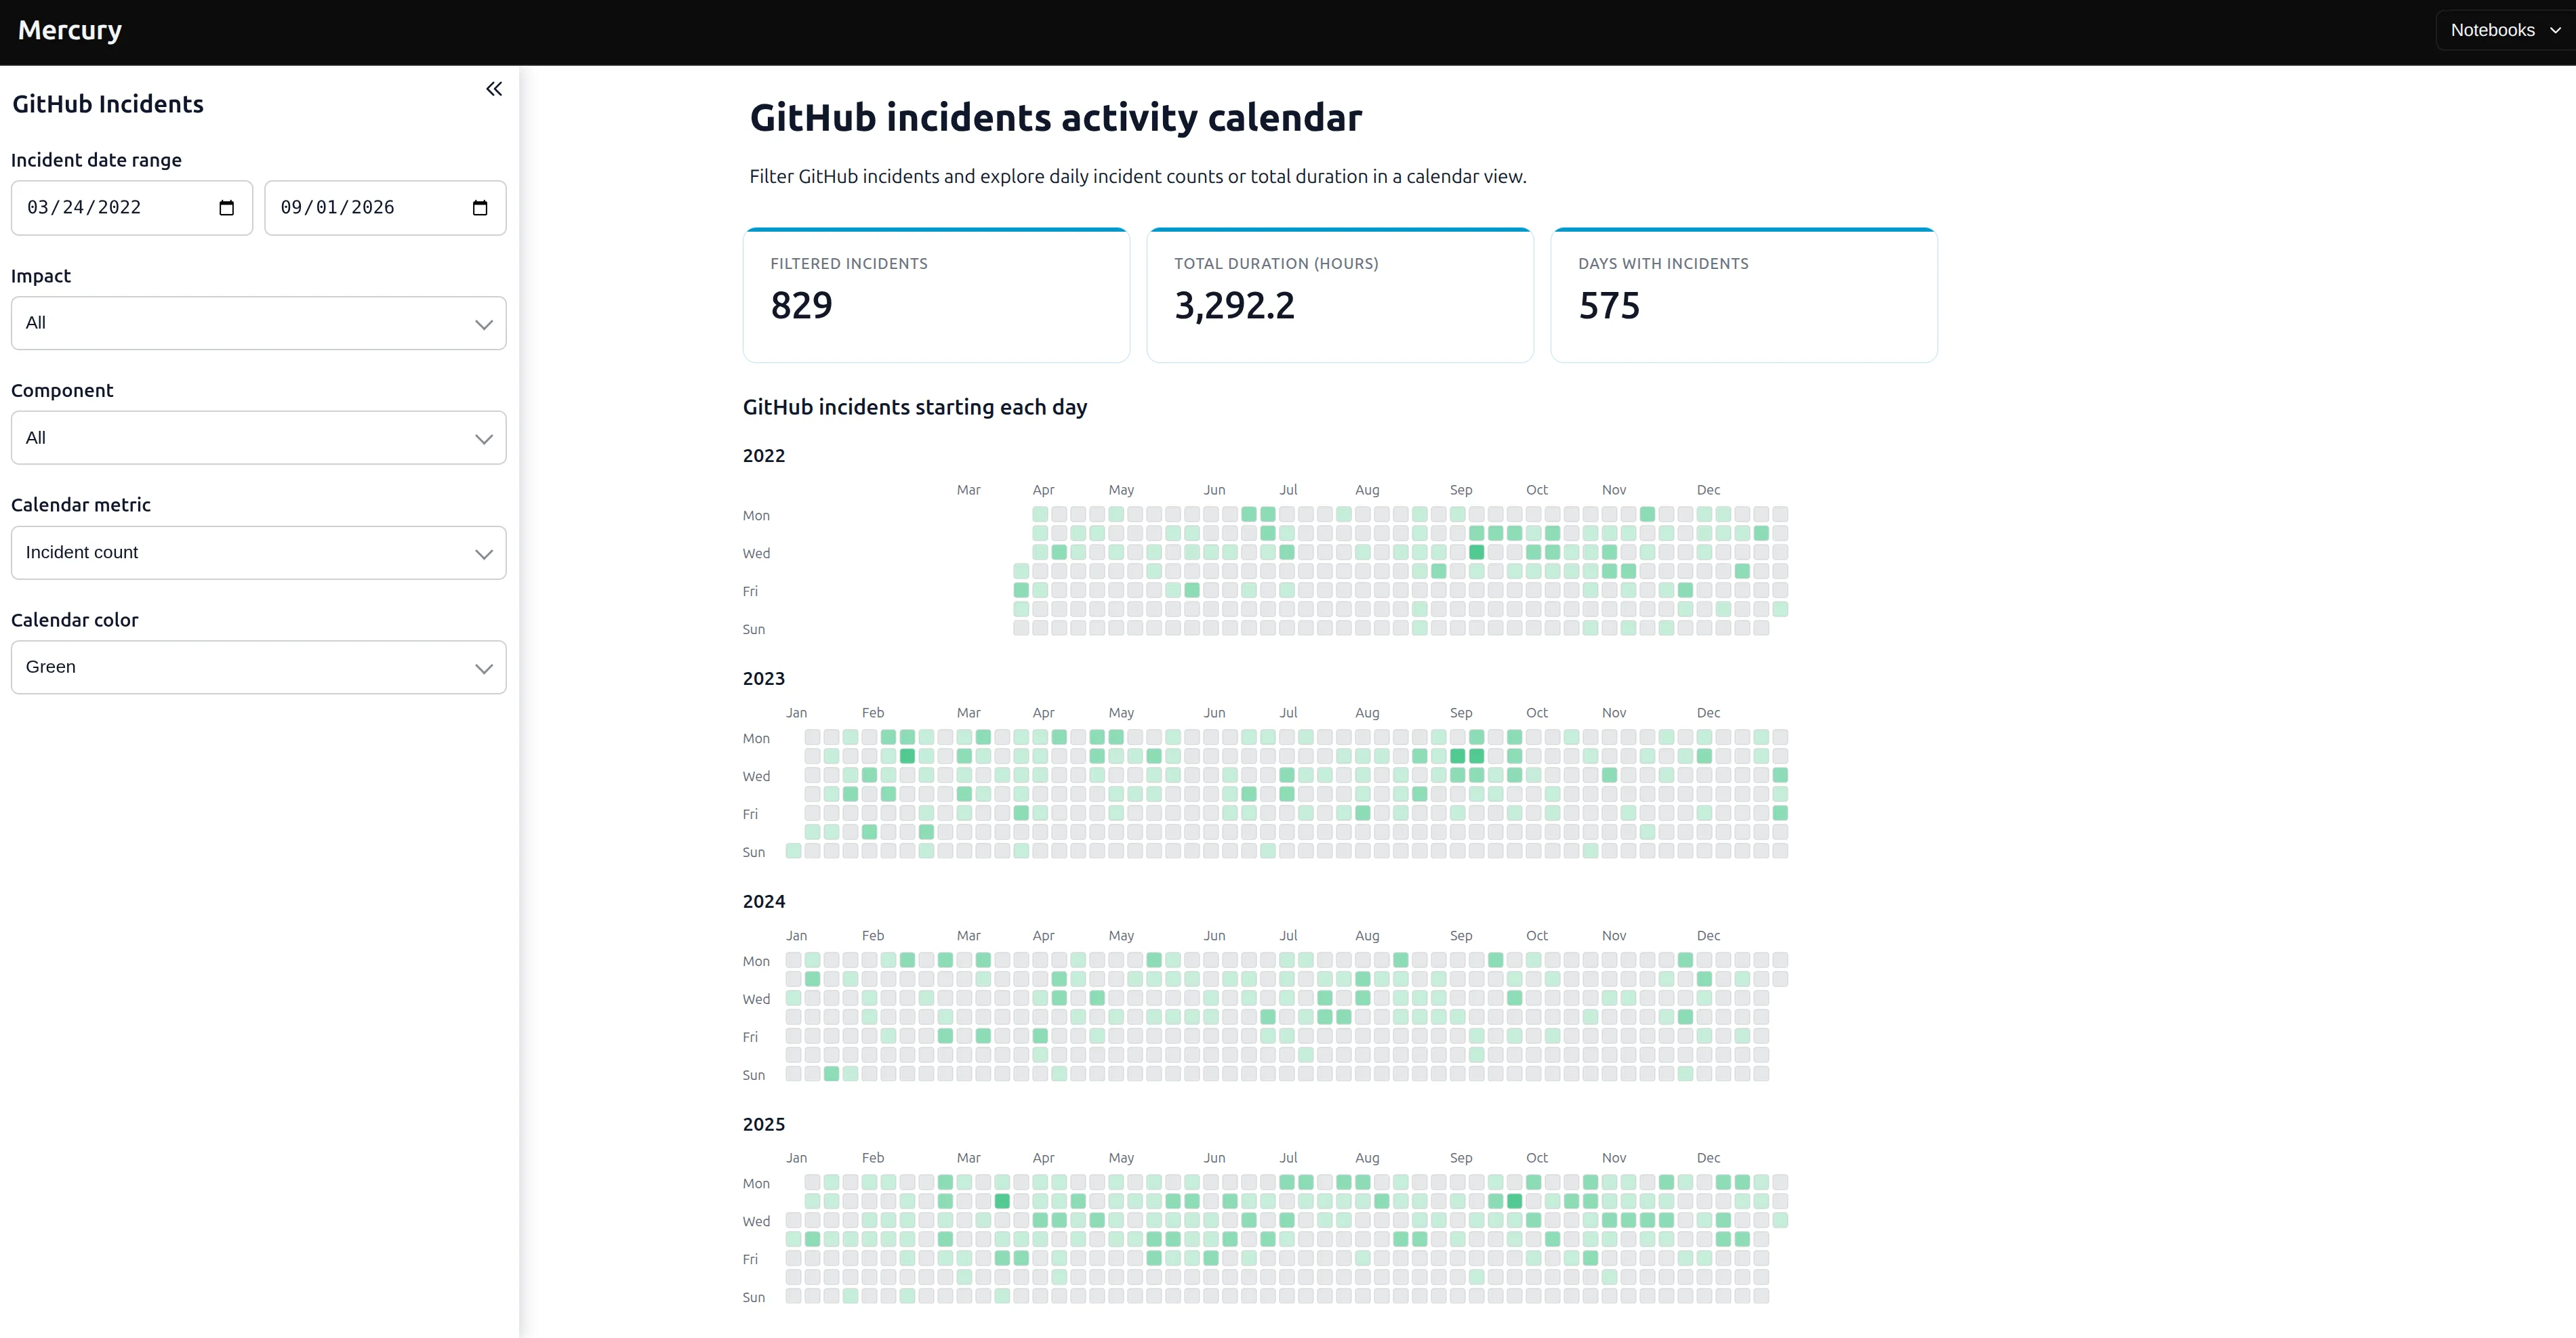
The data preparation and visualization remain normal Python cells. Mercury adds the web interface around them, so there is no separate frontend application to maintain.
Clone the examples repository and start the app with:
git clone https://github.com/mljar/mercury-examples.git
cd mercury-examples
mercury --working-dir github-outages
Open the local address displayed in the terminal. You can also try the deployed application without installing anything.
The complete source, including the component extraction and all URL-backed filters, is in the GitHub outages example directory.
From Python script to interactive outage dashboard
The complete progression looks like this:
GitHub Status data
        ↓
Load records with requests or pandas
        ↓
Parse timestamps and calculate duration
        ↓
Aggregate incidents by day
        ↓
Add Mercury filters and indicators
        ↓
Draw an ActivityCalendar
        ↓
Serve the notebook as an interactive web app
The visualization is the most eye-catching part, but the useful idea is broader: keep the analysis, interface, and explanation together in one reproducible notebook.
Summary
A GitHub-style activity calendar is a compact way to explore years of incident history. Each square retains a precise day, while the color scale makes broader patterns visible immediately.
For recent data, you can query the official GitHub Status API with requests. For a multi-year view, the mrshu/github-statuses archive provides a parsed historical dataset. Pandas handles the timestamps, durations, filters, and daily aggregation. Mercury turns the result into an interactive application without moving the analysis out of Jupyter.
Explore the live GitHub incidents calendar, download the complete notebook, or read the Mercury ActivityCalendar documentation to build your own calendar.
Frequently asked questions
Does GitHub have an outage history?
GitHub publishes current and recent incidents on GitHub Status. For a longer historical view, the independent mrshu/github-statuses project reconstructs and stores incident timelines from GitHub Status feed history.
Does GitHub provide a Status API?
Yes. The public GitHub Status API provides JSON endpoints for the current status, components, incidents, unresolved incidents, and scheduled maintenance. It does not require an API key for these public endpoints.
Does the GitHub incidents API contain the complete history?
No. The api/v2/incidents.json endpoint returns the 50 most recent incidents. Use it for recent-status tools and tutorials, not as a complete historical archive.
Is incident duration the same as GitHub downtime?
No. An incident can affect only one GitHub component, and incidents can overlap. The summed duration in this tutorial is the total duration of incident records, not the amount of time the entire GitHub platform was unavailable.
How do I create a GitHub contribution-style calendar in Python?
Prepare a pandas DataFrame with one row per date and a numeric value, then pass it to mr.ActivityCalendar() using the date and value arguments. Mercury fills missing dates with inactive squares and creates separate calendars for multiple years.
Can I turn this Jupyter Notebook into a web app?
Yes. Add Mercury input widgets to the notebook, then run it with the mercury command. The resulting application can expose filters and recalculate the Python analysis when a user changes a selection.
About the Author

Piotr Płoński
Piotr Płoński is a software engineer and data scientist with a PhD in computer science. He has experience in both academia—working on neutrino experiments at leading research labs and collaborating on interdisciplinary projects—and in industry, supporting major clients at Netezza, IBM, and iQor. In 2016, he founded MLJAR to make data science easier and more accessible, creating tools like AutoML, Mercury, and MLJAR Studio.
Related Articles
- Why ipynb is a perfect format for saving AI data analysis conversations
- 10 ways to make predictions with Machine Learning model
- Build a Web App for your Machine Learning model
- How to Run a Local LLM in 2026
- XGBoost Vector Leaf: Multi-Output Regression Explained
- 3 New Mercury Widgets for Interactive Python Data Apps
- I Analyzed 4.5 Years of GitHub Incidents. Here Is What Changed.
- How Hard Is It to Find a Remote Python Data Job? I Checked 88,975 Hacker News Job Posts
- Are iPhones Really More Expensive? An Inflation-Adjusted Dashboard in Python
- How to Use Jev in Python: Choice, Noul, Score + OpenAI Comparison
Private AI data analysis
AI Data Analyst on Your Computer
Use MLJAR Studio to explore data, discover insights, and create reports with AI.
Runs locally · Your data stays private