
A customer export lands in your inbox. At first glance, it looks fine. There are 530 rows, seven columns, and nothing obviously broken. Then you try to calculate total monthly spend and the result looks strange. You sort customers by signup date and the order makes no sense. You count customers by country and Poland appears several times under slightly different names.
This is a common spreadsheet problem. A file can look perfectly normal while containing small inconsistencies that make later analysis unreliable. Maybe several people edited it, the export format changed, or values were entered by hand over time.
In this tutorial, we will clean a customer Excel file with Python in MLJAR Studio. We will not ask AI to “clean everything” in one step. Instead, we will inspect the data and fix one problem at a time. After every important change, we will check the result before continuing.
You can also open the full MLJAR Studio conversation to inspect all prompts, generated Python code, and outputs from this tutorial.

Why clean the data one step at a time?
We could start with a prompt such as:
clean this file
and let AI decide what to do. For some datasets that might produce a reasonable result, but we would not really know what changed.
Data cleaning often involves decisions rather than obvious fixes. If monthly_spend is empty, should it become zero or remain empty? If two rows have the same customer ID but different email addresses, which one should we keep? If a date is written as 03/04/2024, does it mean April 3 or March 4?
A spreadsheet can still look clean after making the wrong decision. The danger is that the numbers may quietly mean something different.
That is why we will keep a human in the analysis loop. We will inspect each problem, make one change, and verify what happened. The final notebook will record how the original spreadsheet became the cleaned one.
Before we start
MLJAR Studio is a desktop application built on JupyterLab. It works with files directly on your computer, so Python can open a spreadsheet from your disk without requiring an upload first.
We will use the AI assistant to generate Python code, but that Python runs locally. The conversation is saved as a normal Jupyter notebook, so you can inspect the code, change it, rerun it later, or open the .ipynb file in another compatible application.
Get the data
Download the demo file from datasets-for-start and put it in:
~/Documents/customers/
The file is called customers.xlsx. It contains 530 customer records and seven columns.

The workbook is messy in several ways that are common in real exports. It contains 30 exact duplicate rows, missing values represented by blanks, N/A, and -, dates stored in different formats, and 21 country labels for only six real countries.
We will find and fix these problems one at a time instead of making assumptions about the whole file at once.
Load the Excel file
Open MLJAR Studio and choose Start a New AI Conversation. Then use the Read a file button and select customers.xlsx.
Reading is not uploading. MLJAR Studio opens
customers.xlsxdirectly from your computer. The workbook stays on your disk, and the generated Python code performs all loading, cleaning, and calculations locally on your machine.

You do not need to type the path manually. Studio creates the instruction after you select the file.

The generated Python looks like this:
import pandas as pd df = pd.read_excel("/home/piotr/Documents/customers/customers.xlsx") print(f"Shape: {df.shape}") columns = df.columns.tolist() print(f"Columns ({len(columns)}):", columns if len(columns) <= 100 else columns[:100] + ["..."]) df.head()
The result tells us:
Shape: (530, 7) Columns (7): ['customer_id', 'full_name', 'email', 'country', 'signup_date', 'plan', 'monthly_spend']
The preview already gives us one clue: signup dates use several formats. One row contains 14/09/2024, another contains April 29, 2023, and another uses 2024-09-13. They all represent dates, but pandas may not currently see them that way.
Check column types and duplicate rows
Before changing anything, ask:
show types for each column
Studio runs df.dtypes. Then ask:
how many rows are exact duplicates

The types include:
customer_id str full_name str email str country str signup_date str plan str monthly_spend object
signup_date is text rather than a date. We cannot reliably sort it chronologically, filter by month, or calculate customer tenure. monthly_spend is object rather than numeric, which usually means some values in the column are not numbers.
The duplicate check:
df.duplicated().sum()
returns np.int64(30). These are exact copies: all seven values in one row match another row. Removing them is different from resolving two records with the same customer ID but conflicting details; that would require a human decision about which record is correct.
For a closer look at that distinction and the safety check on repeated IDs, see Remove Duplicate Rows from Excel with Python.
Check for missing values
The workbook represents missing information in three ways: empty cells, N/A, and a single dash. Ask:
count missing values per column, treating N/A and - as missing

Studio generates:
missing_counts = df.isna() | df.astype("string").apply( lambda col: col.str.strip().isin(["N/A", "-"]) ) missing_counts.sum()
The result is:
customer_id 0 full_name 21 email 21 country 0 signup_date 0 plan 0 monthly_spend 18
The wording of the prompt matters. Pandas recognizes empty cells and often N/A, but a dash is just text. Without explicitly treating - as missing, it is easy to overlook. This also explains why monthly_spend was not numeric: it contains numbers mixed with text placeholders.
The focused Handle Missing Values in Excel with Python tutorial compares the incomplete 40-value count with the corrected 60-value count and explains why unknown values should not automatically become zero.
Remove duplicates and make monthly_spend numeric
Ask Studio to remove exact duplicates:
remove duplicate rows
Then ask:
replace the remaining - values with nulls and convert monthly_spend to numeric

Studio generates:
df = df.drop_duplicates().reset_index(drop=True) df = df.replace(r"^\s*-\s*$", pd.NA, regex=True) df["monthly_spend"] = pd.to_numeric(df["monthly_spend"], errors="coerce") print(df.shape) print(df["monthly_spend"].dtype)
The result is 500 rows and a float64 spend column. We started with 530 rows, identified 30 exact duplicates, and ended with the expected 500 records.
The regular expression only matches cells whose entire value is a dash, optionally surrounded by spaces. It does not remove dashes from names, email addresses, or other text.
Fix mixed signup dates
Ask:
parse signup_date into a proper date column, handle mixed formats, treat slash dates as day-first, then show how many parsed and the min and max date

Studio generates:
df["signup_date"] = pd.to_datetime( df["signup_date"], format="mixed", dayfirst=True, errors="coerce", ) pd.Series( { "parsed_dates": df["signup_date"].notna().sum(), "min_date": df["signup_date"].min(), "max_date": df["signup_date"].max(), } )
The result is:
parsed_dates 500 min_date 2023-01-13 00:00:00 max_date 2025-01-13 00:00:00
All 500 dates parsed successfully. format="mixed" handles the different formats. dayfirst=True tells pandas how to interpret slash dates according to this dataset's convention.
This is a human-in-the-loop decision: Python cannot infer an organization's date convention from an ambiguous value such as 03/04/2024. The demo data avoids truly ambiguous slash dates, but real exports may not. Always confirm the convention and inspect the resulting date range.
For the format inventory, parsing alternatives, and verification pattern in isolation, see Fix Mixed Date Formats in Excel with Python.
Standardize country names
Ask:
standardize the country column to full country names
Studio first inspects the existing values, then creates a mapping.

The original data includes variants such as Poland, POLAND, poland, PL, and Polska. If we group the uncleaned data, these values appear as separate countries.
Studio generates a mapping based on the values it found:
country_map = { "poland": "Poland", "pl": "Poland", "polska": "Poland", "germany": "Germany", "de": "Germany", "france": "France", "fr": "France", "spain": "Spain", "es": "Spain", "italy": "Italy", "it": "Italy", "united states": "United States", "usa": "United States", "u.s.": "United States", } normalized_country = ( df["country"] .astype("string") .str.strip() .str.casefold() ) df["country"] = normalized_country.map(country_map).fillna( df["country"].astype("string").str.strip() ) df["country"].value_counts(dropna=False)
The cleaned counts are:
Poland 192 Germany 97 France 77 Spain 55 United States 42 Italy 37
The values now represent six countries and still total 500 customers. The fillna() fallback preserves an unfamiliar value instead of silently erasing it. If a seventh country appears next month, it remains visible for review.
The focused Standardize Text Categories in Excel with Python tutorial shows all 21 original labels, explains the reviewed mapping, and preserves unfamiliar values for later inspection.
Review the cleaned data
MLJAR Studio keeps notebook variables in the Variable Inspector. Click the value icon next to a dataframe to open it in a spreadsheet-like view.

Open df and inspect the result.

We now have 500 rows and seven columns. Exact duplicates are gone, monthly_spend is numeric, signup dates are real dates, and country names are consistent.
You will still see null values in some full_name, email, and monthly_spend cells. That is intentional.
Why we did not fill the missing values
Filling every empty cell can make a spreadsheet look more complete while making it less truthful. Setting missing monthly_spend to zero would claim that a customer pays nothing. That is different from saying their spend is unknown. Dropping every row with one missing value would remove otherwise useful customer records.
The plan column appears to suggest standard prices—Free is 0, Basic is 19, Pro is 49, and Enterprise is 199—but we should verify that business rule before reconstructing missing spend. A legacy price, discount, or custom contract could make an automatic fill incorrect.
Sometimes leaving a value missing is the correct data-cleaning decision.
Save the cleaned Excel file
Ask:
save the cleaned file as customers-clean.xlsx

Studio generates:
output_path = "/home/piotr/Documents/customers/customers-clean.xlsx" df.to_excel(output_path, index=False) output_path
The original customers.xlsx remains untouched. The changes happened in memory and the result was written to a new file.
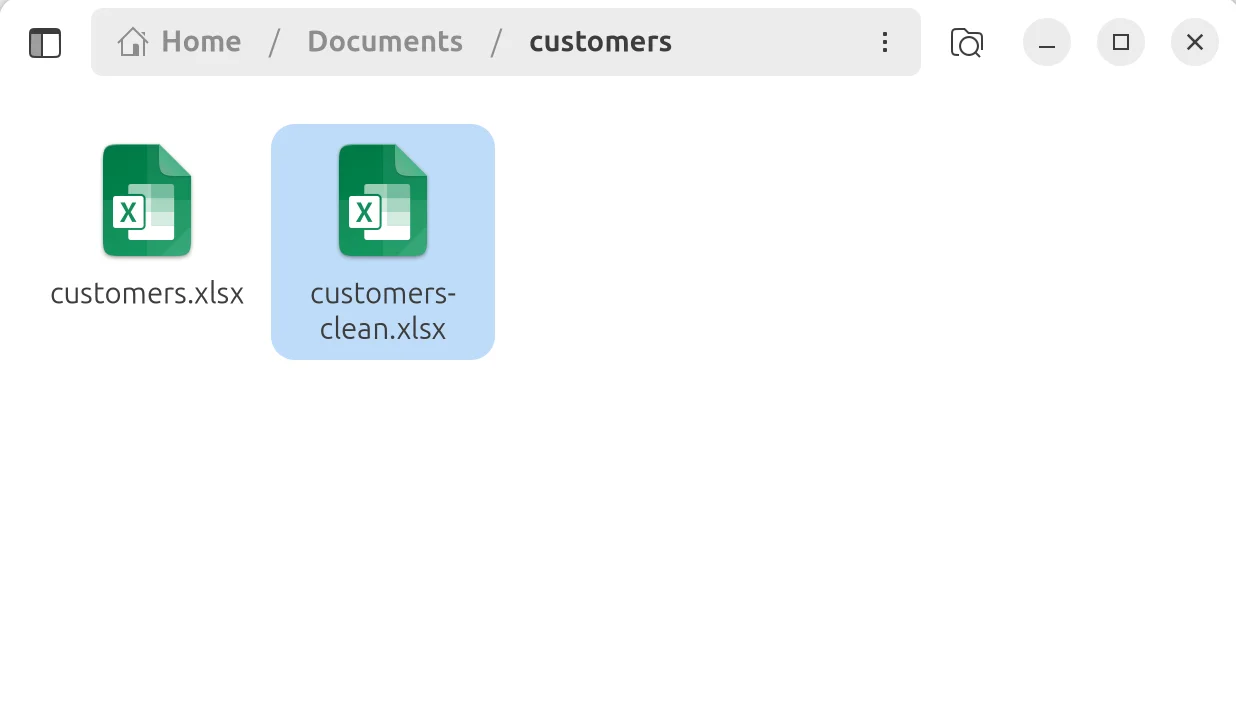
Saving to a new filename gives us an easy way back. If a cleaning decision turns out to be wrong, we still have the original data and can revise the notebook instead of trying to undo changes in Excel.
Reuse the cleaning notebook
The conversation is a normal Jupyter notebook. Prompts become markdown cells, generated Python becomes code cells, and outputs are saved beside them.

Next month, change the input file and run the notebook again. The checks reveal how many duplicates were found, whether new missing-value tokens appeared, whether all dates parsed, and whether somebody introduced a new country label.
The notebook is also documentation. Another person can see what changed, in what order, what assumptions were made, and what checks were performed. That is much easier to audit than a file called customers-final-final-clean.xlsx with no explanation.
A note on privacy
MLJAR Studio reads customers.xlsx from your disk and runs the cleaning code locally. The workbook does not need to be uploaded before Python can work with it.
If you use a cloud AI provider, the model needs context such as your prompt, column names, dataframe shape, and possibly preview values. For a real customer dataset containing names and email addresses, consider carefully what context may be sent.
To keep the AI part local too, connect MLJAR Studio to a local LLM through Ollama, vLLM, LM Studio, Jan, or llama.cpp. Then prompts, data context, generated code, and results can remain on your own computer or infrastructure.
Summary
We started with 530 rows that looked reasonable but contained common data-quality problems. We inspected before changing anything, removed 30 exact duplicate rows, recognized missing values written three ways, converted monthly_spend to numeric, parsed mixed date formats, and standardized 21 country labels into six consistent names.
The result contains 500 customer records. Genuinely unknown values remain null instead of being replaced with guesses, and the cleaned workbook was saved separately so the original stayed unchanged.
More importantly, the process is now stored in a reusable notebook with visible Python, intermediate checks, and human decisions.
Next steps
- Compare exact and fuzzy duplicate checks before choosing how aggressively to match customer records
- Remove duplicate rows safely by checking exact copies against repeated customer IDs
- Find near-duplicate companies with RapidFuzz, supporting fields, and human review
- Handle missing values represented by blanks,
N/A, and dashes - Fix mixed date formats and verify that every date survived conversion
- Standardize text categories with an explicit, reviewable mapping
- Turn a reviewed Excel workflow into a web app with filters, indicators, charts, and controlled publishing