
I Analyzed 4.5 Years of GitHub Incidents. Here Is What Changed.
For three years, GitHub reported an incident somewhere in its services during about 3% of the time. In 2025 that doubled. In 2026 so far it is close to 10%. The typical incident got about 15 minutes longer. That is the main finding from my analysis of 789 unplanned incidents between March 2022 and September 2026. What changed was how often incidents started, and how long the rare, drawn-out ones ran.
I used a historical archive of GitHub's public status reports. It covers services such as Actions, Pull Requests, API Requests, Codespaces, and Copilot. Here is the whole period in one picture:
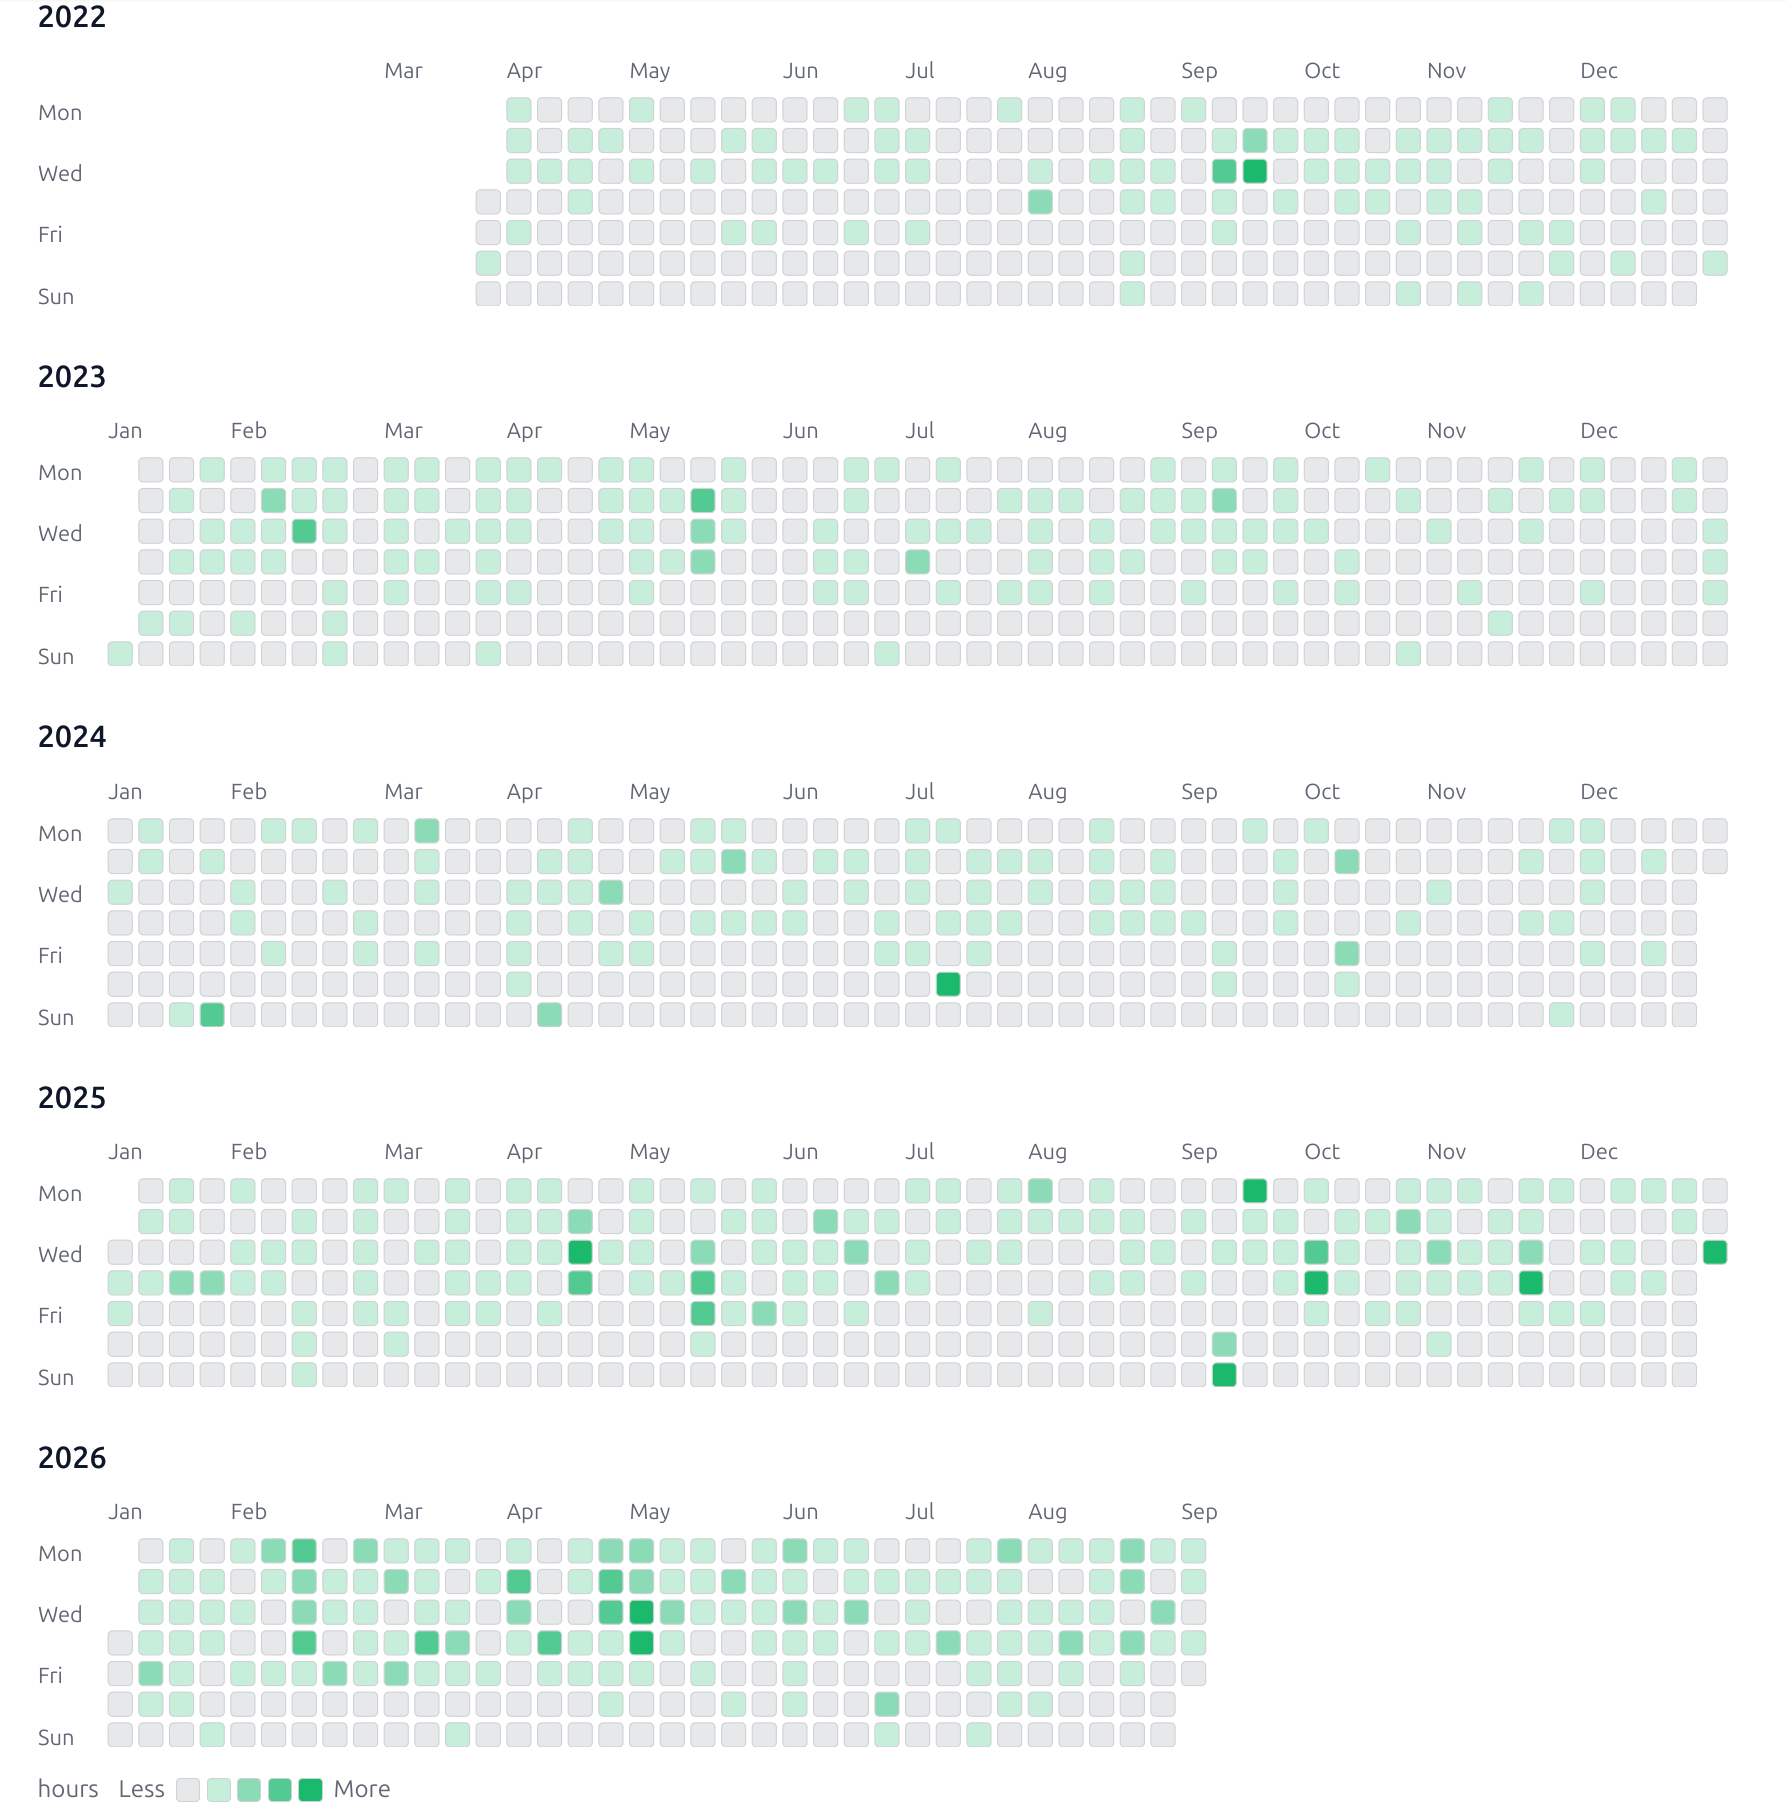
Each square is one UTC day. Darker green means more hours with at least one reported incident active. Overlapping incidents count only once. Across the observation period, that adds up to 1,816.7 hours, or 4.66% of the time. Roughly one hour in every twenty-one.
This does not mean GitHub.com was down 4.66% of the time. An incident might affect only one feature or a subset of users. This measures time with a reported incident somewhere in GitHub's services. It cannot tell us how often your own workflow was affected. With that distinction in place, here is the shape of the change.
The break came in 2025
Three flat years, then a step change:
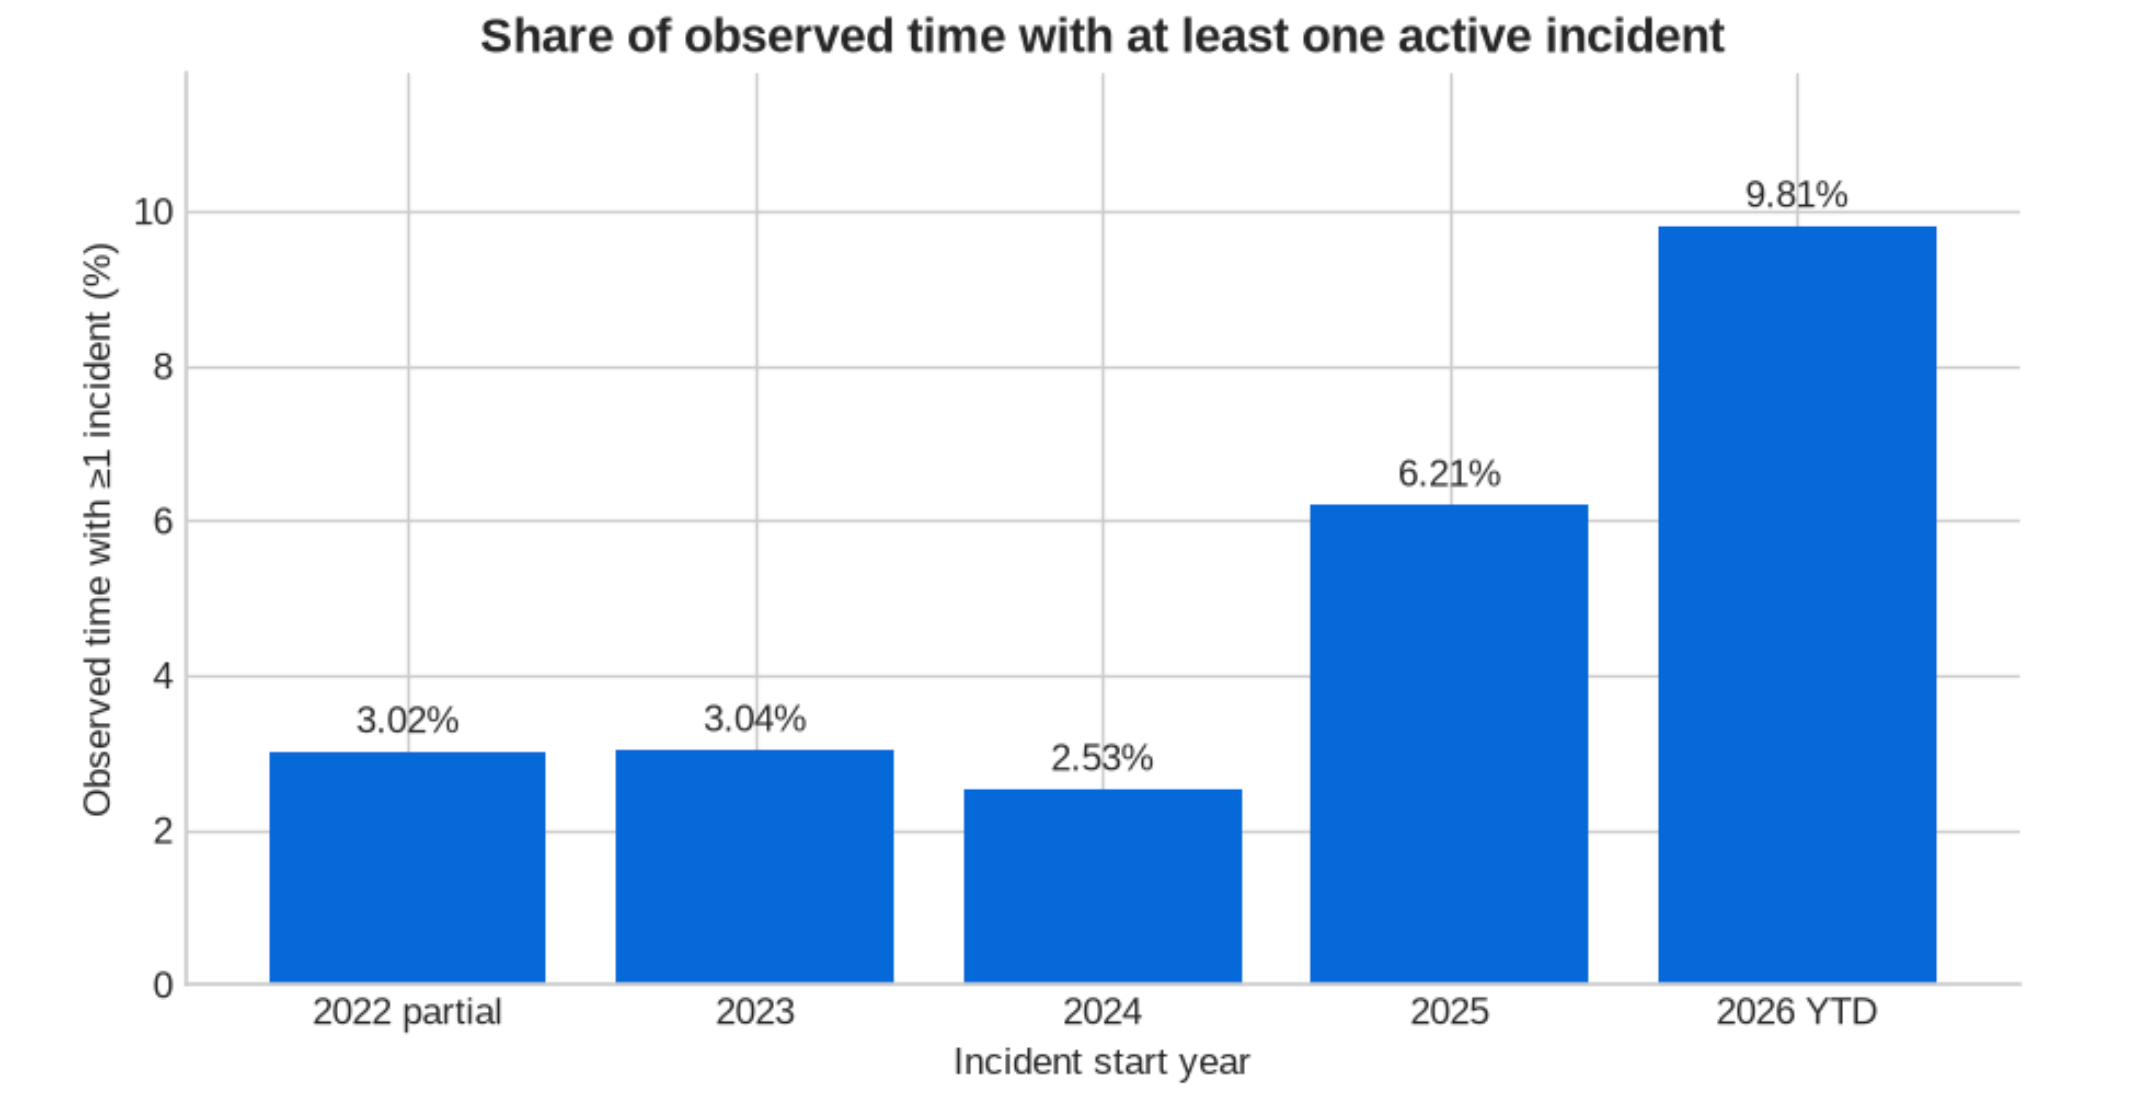
3.02% in 2022, 3.04% in 2023, 2.53% in 2024, then 6.21% in 2025 and 9.81% in 2026 so far. 2024 was the quietest year in the archive. In 2026, GitHub has had at least one reported incident active for nearly one hour in ten.
Incident starts follow the same shape. 2024 ran at about 10 incidents per observed month, close to the 2022 rate. The rise came afterwards.
Both endpoint years are incomplete, so comparing raw annual totals would be misleading. Instead I divided incident counts by the amount of each year actually observed.
| Measure | 2022, from March 24 | 2026, through September 4 |
|---|---|---|
| Incident starts per observed month | 10.9 | 26.6 |
| Median time between incident starts | 37.3 hours | 17.1 hours |
| Time with at least one incident active | 3.02% | 9.81% |
The reported incident rate is about 2.4 times higher. The median time between starts has more than halved.
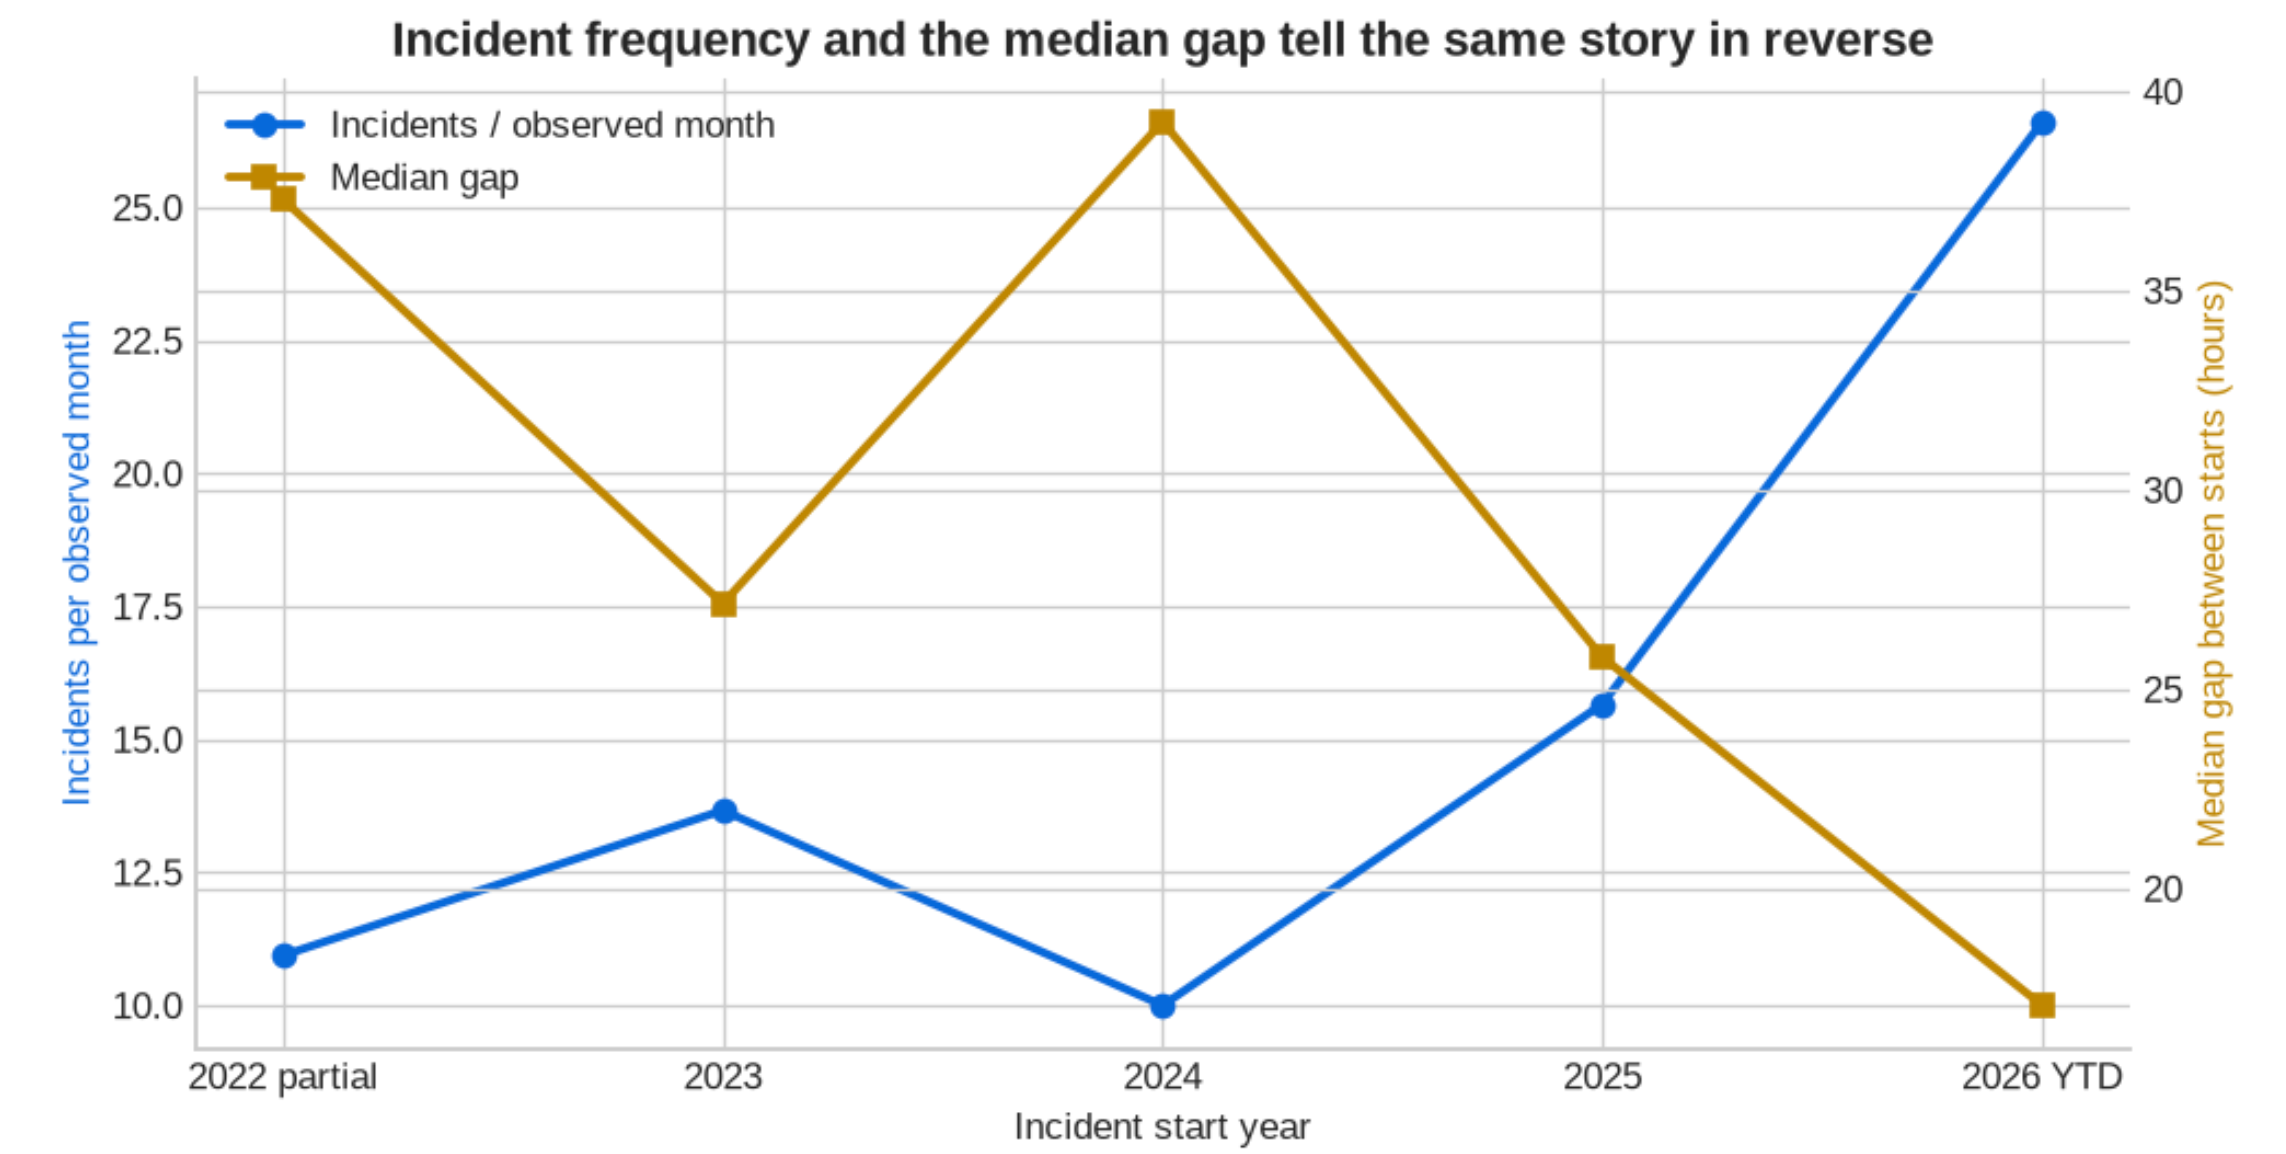
One detail matters: a gap between starts is not necessarily quiet time. The previous incident could still be open. I use the full incident windows to measure active time separately.
These numbers describe a public incident archive, not GitHub's underlying infrastructure. Reporting scope can change, and later in this article there is evidence that it did.
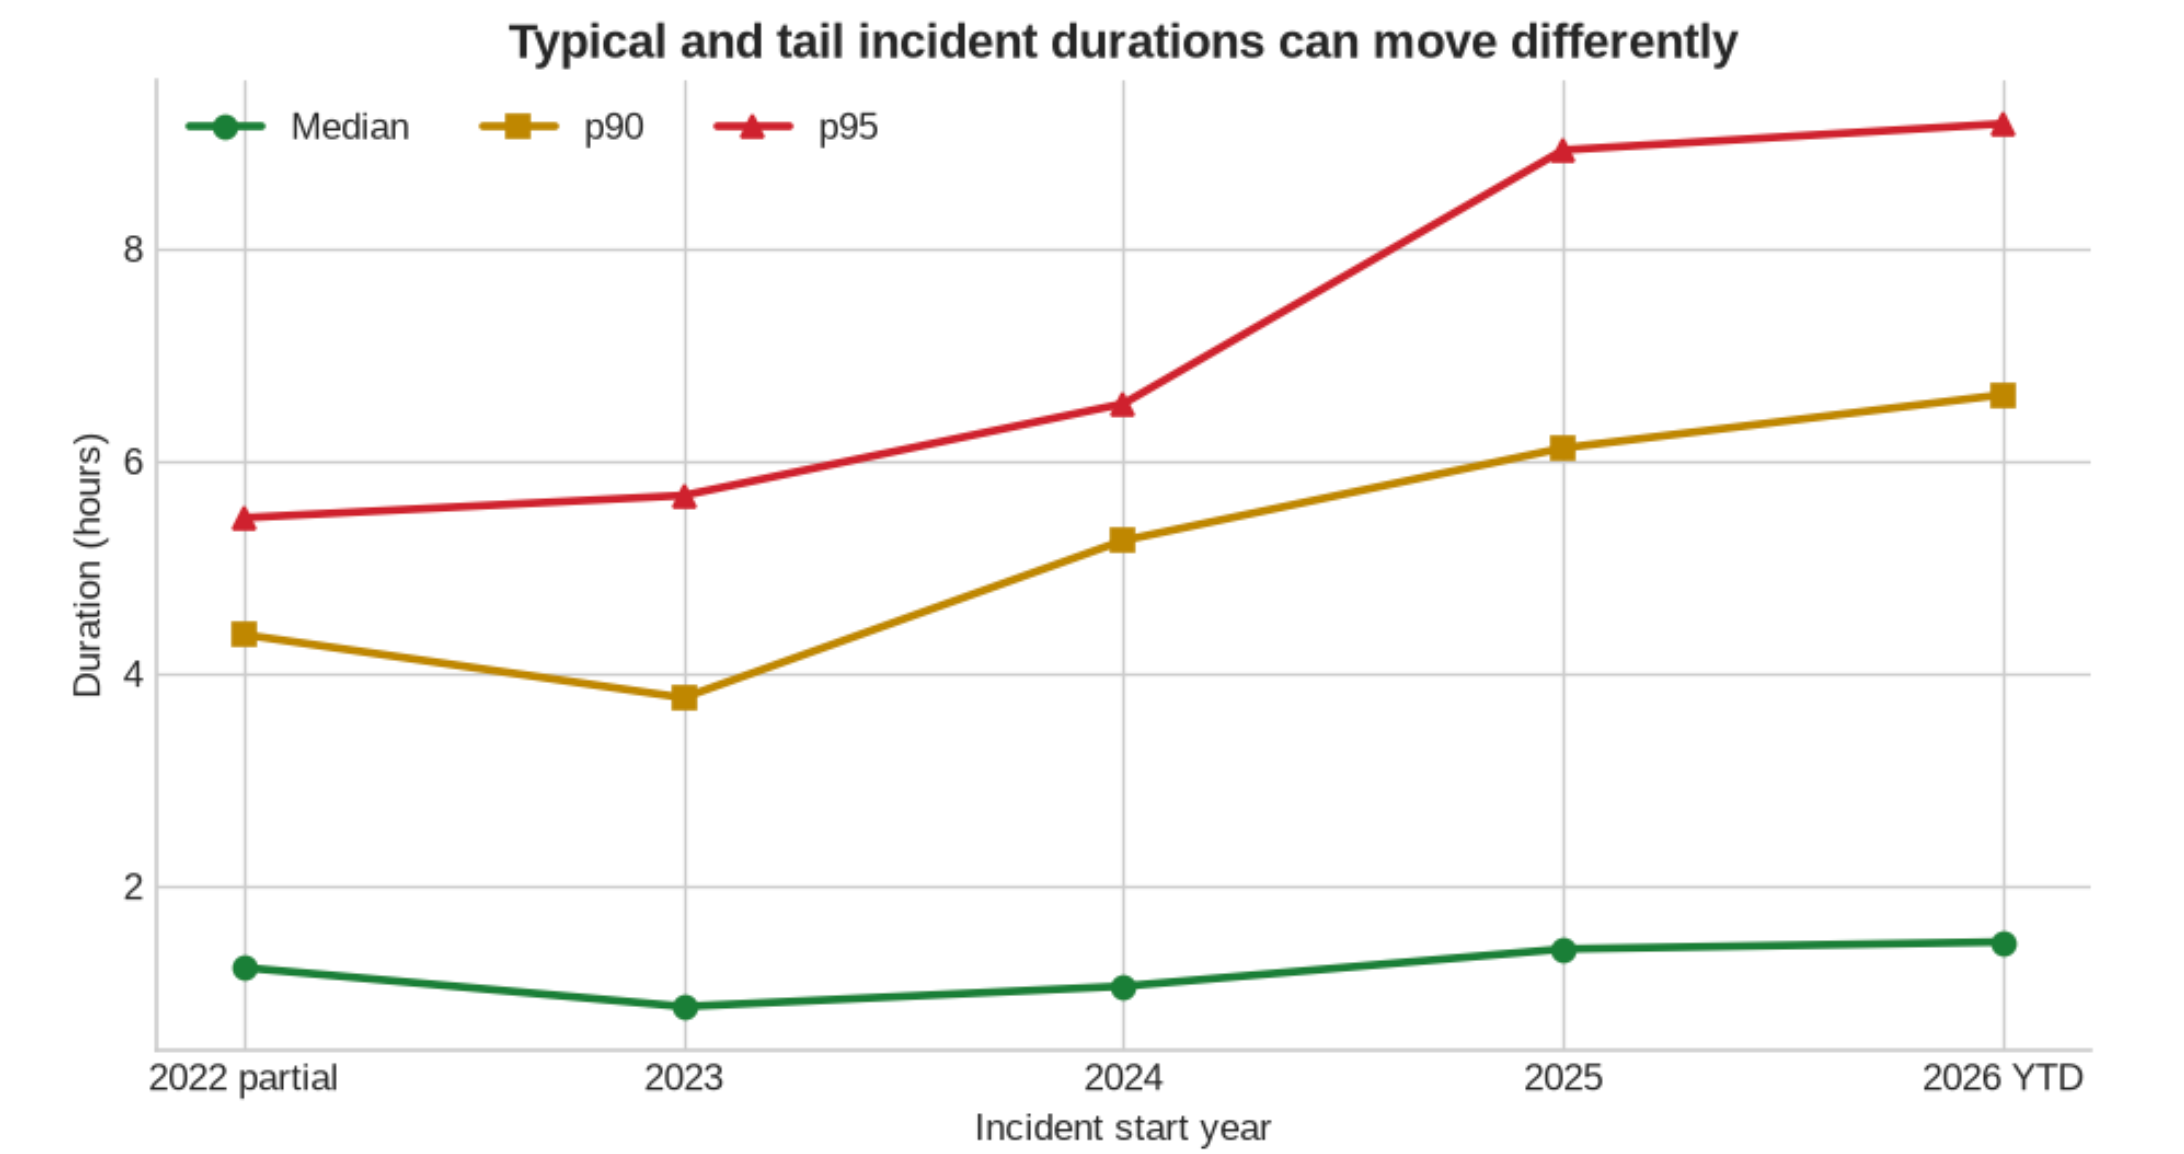
The typical incident changed little. The longest ones changed more.
The median incident lasted 1.23 hours in the observed part of 2022 and 1.48 hours in 2026 so far. That is about 74 minutes versus 89 minutes. The long incidents tell a different story.
The 95th percentile rose from 5.47 hours to 9.18 hours, an increase of about 68%. The cutoff for the longest 5% of incidents moved from roughly five and a half hours to more than nine.
The longest incident in the cleaned dataset lasted 61.97 hours. It started on April 28, 2026, with the title:
Incomplete pull request results in repositories
Across all 789 incidents, the median duration is 1.27 hours, while the mean is 2.41 hours. A small number of long incidents pull the mean upward: the longest 1% account for 15.4% of all summed incident-hours.
That is why a single average hides so much. Most incidents are fairly short. A few run for days.
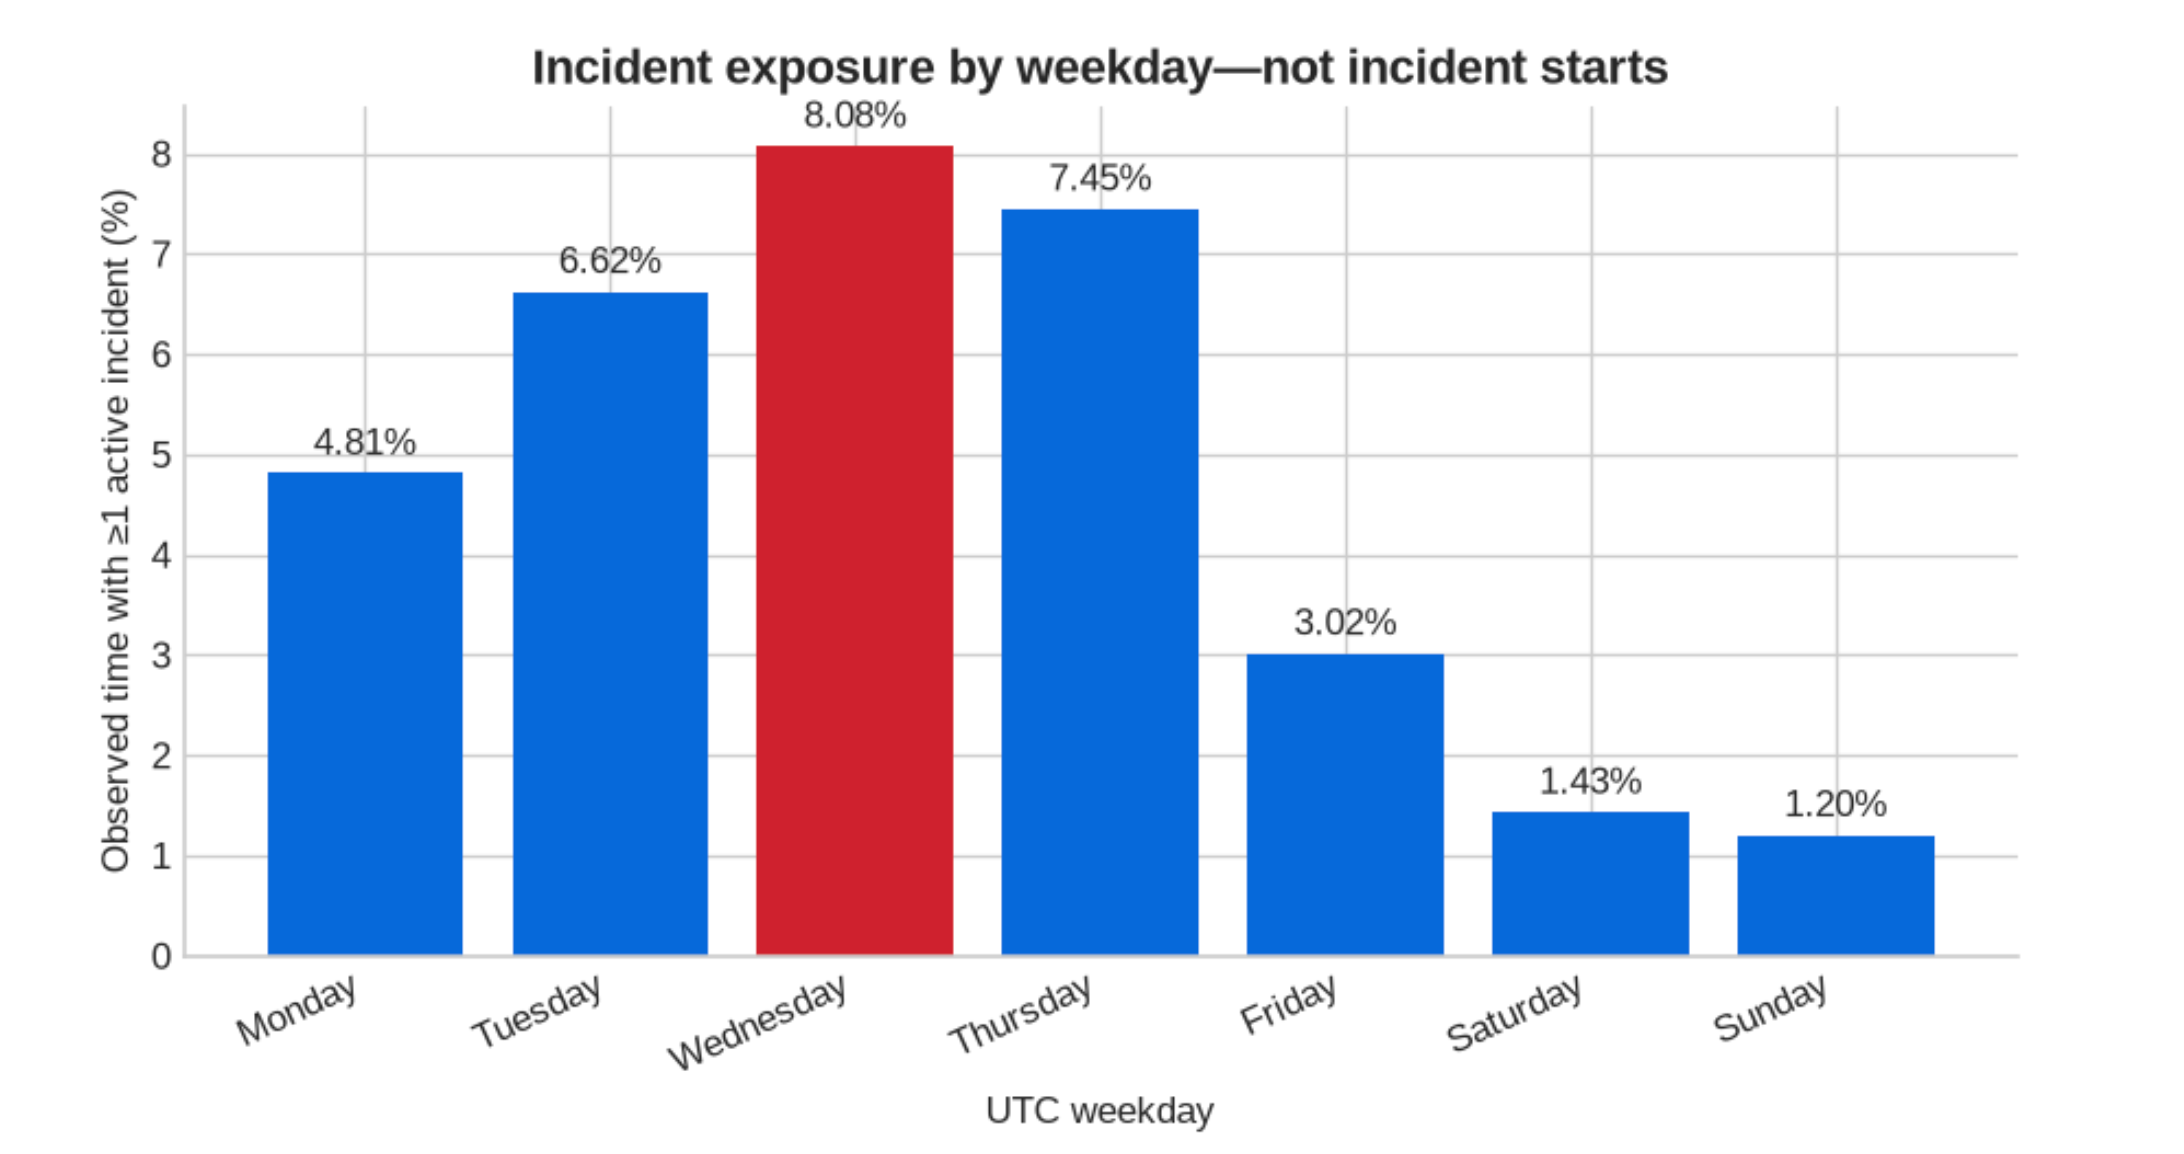
Wednesday has 6.7 times Sunday's incident exposure
The direction here is not surprising. GitHub's engineers work weekdays and ship changes on weekdays. The size of the gap is what stands out.
At least one incident was active during 8.08% of observed Wednesday time, compared with about 1.20% on Sundays. That makes Wednesday's share roughly 6.7 times higher.
Breaking each weekday into hours makes the pattern clearer:
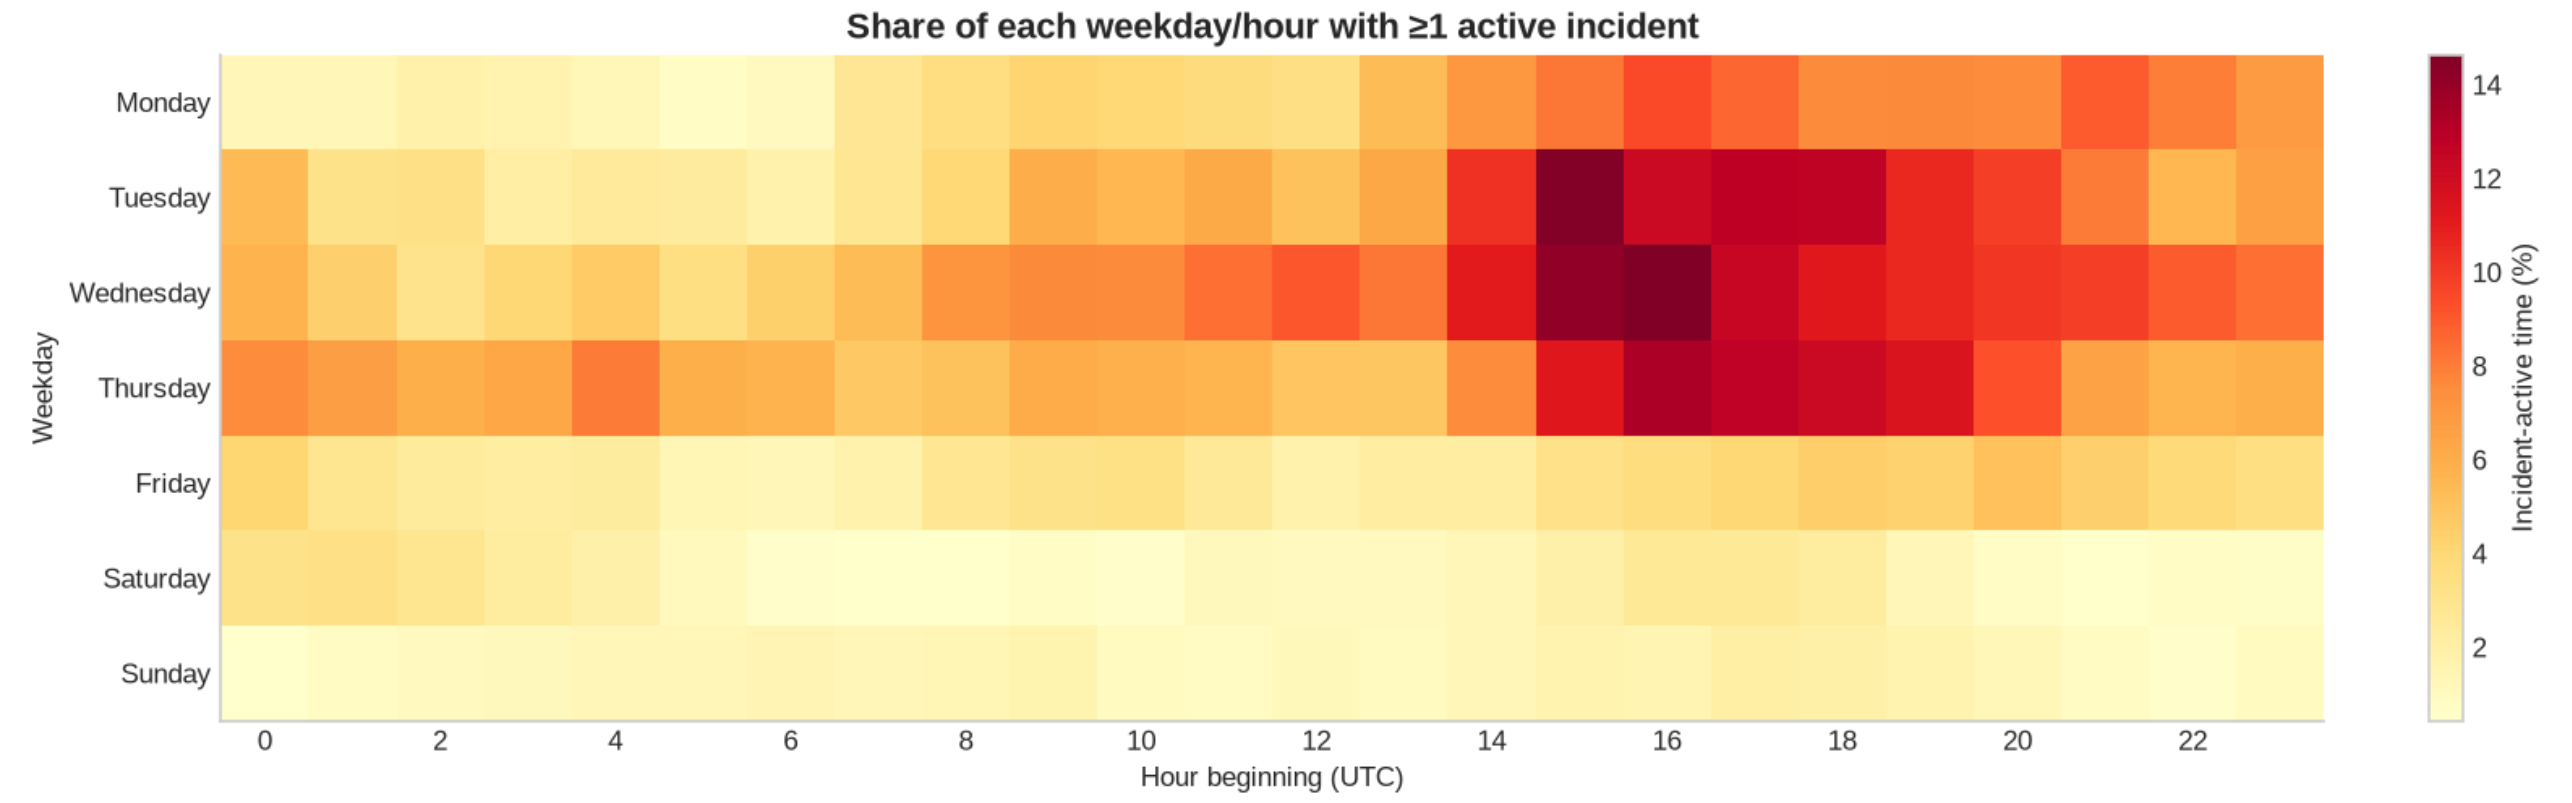
Across all weekdays combined, incident starts peak at 14:00 UTC, while time with an incident active peaks at 16:00 UTC. That two-hour offset is the useful part. Counting starts tells you when incidents begin. Following the full windows tells you when they are still affecting the status picture. An incident that starts at 14:00 keeps contributing hours well into the afternoon.
The mix of services shifted toward Copilot
The services appearing in incident reports changed too.
For this comparison I used the archive's component metadata, which contains more information than the incident titles alone.
| Service | Share of incidents in 2022, from March 24 | Share in 2026, through September 4 |
|---|---|---|
| Actions | 30.7% | 25.5% |
| Copilot | 4.0% | 25.0% |
| Codespaces | 28.7% | 5.6% |
Copilot gained 21 percentage points. Codespaces lost about 23 points. Actions stayed common throughout the period.
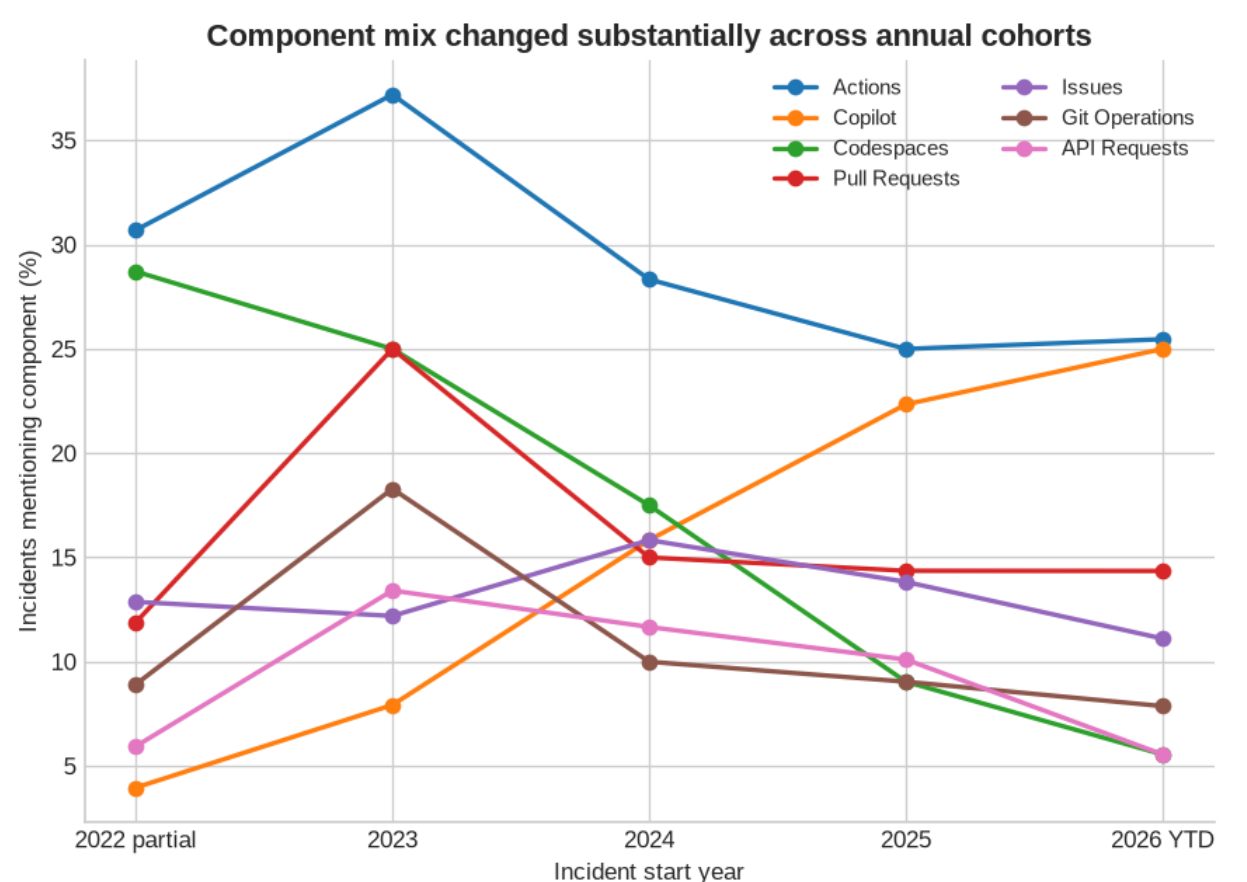
Product timelines explain part of this. Copilot became generally available to individual developers in June 2022, three months into the archive, and has since grown from one autocomplete feature into a family of products. Codespaces opened to individual users that November. A service that ships more surface area to more people will show up in more incident reports.
So this is a change in the mix of reports. It does not establish that Copilot is less reliable than Codespaces, or that Copilot caused GitHub's overall increase.
The dataset has no service-usage denominator: no request counts, active users, or workloads to compare against. A growing service could appear in more reports even if its failure rate per request stayed the same.
Component labels also have gaps. 18% of incidents have no attributed component, and 9.8% use model-inferred labels from the archive. One incident can affect several services, so these shares do not need to add up to 100%.
Incidents rarely overlap
Nearly half of consecutive incident starts, 49.1%, fall within 24 hours of the previous one. In 2026 so far it is 62.5%. That mostly follows from the rate itself. When incidents happen more often, the gaps between them get shorter.
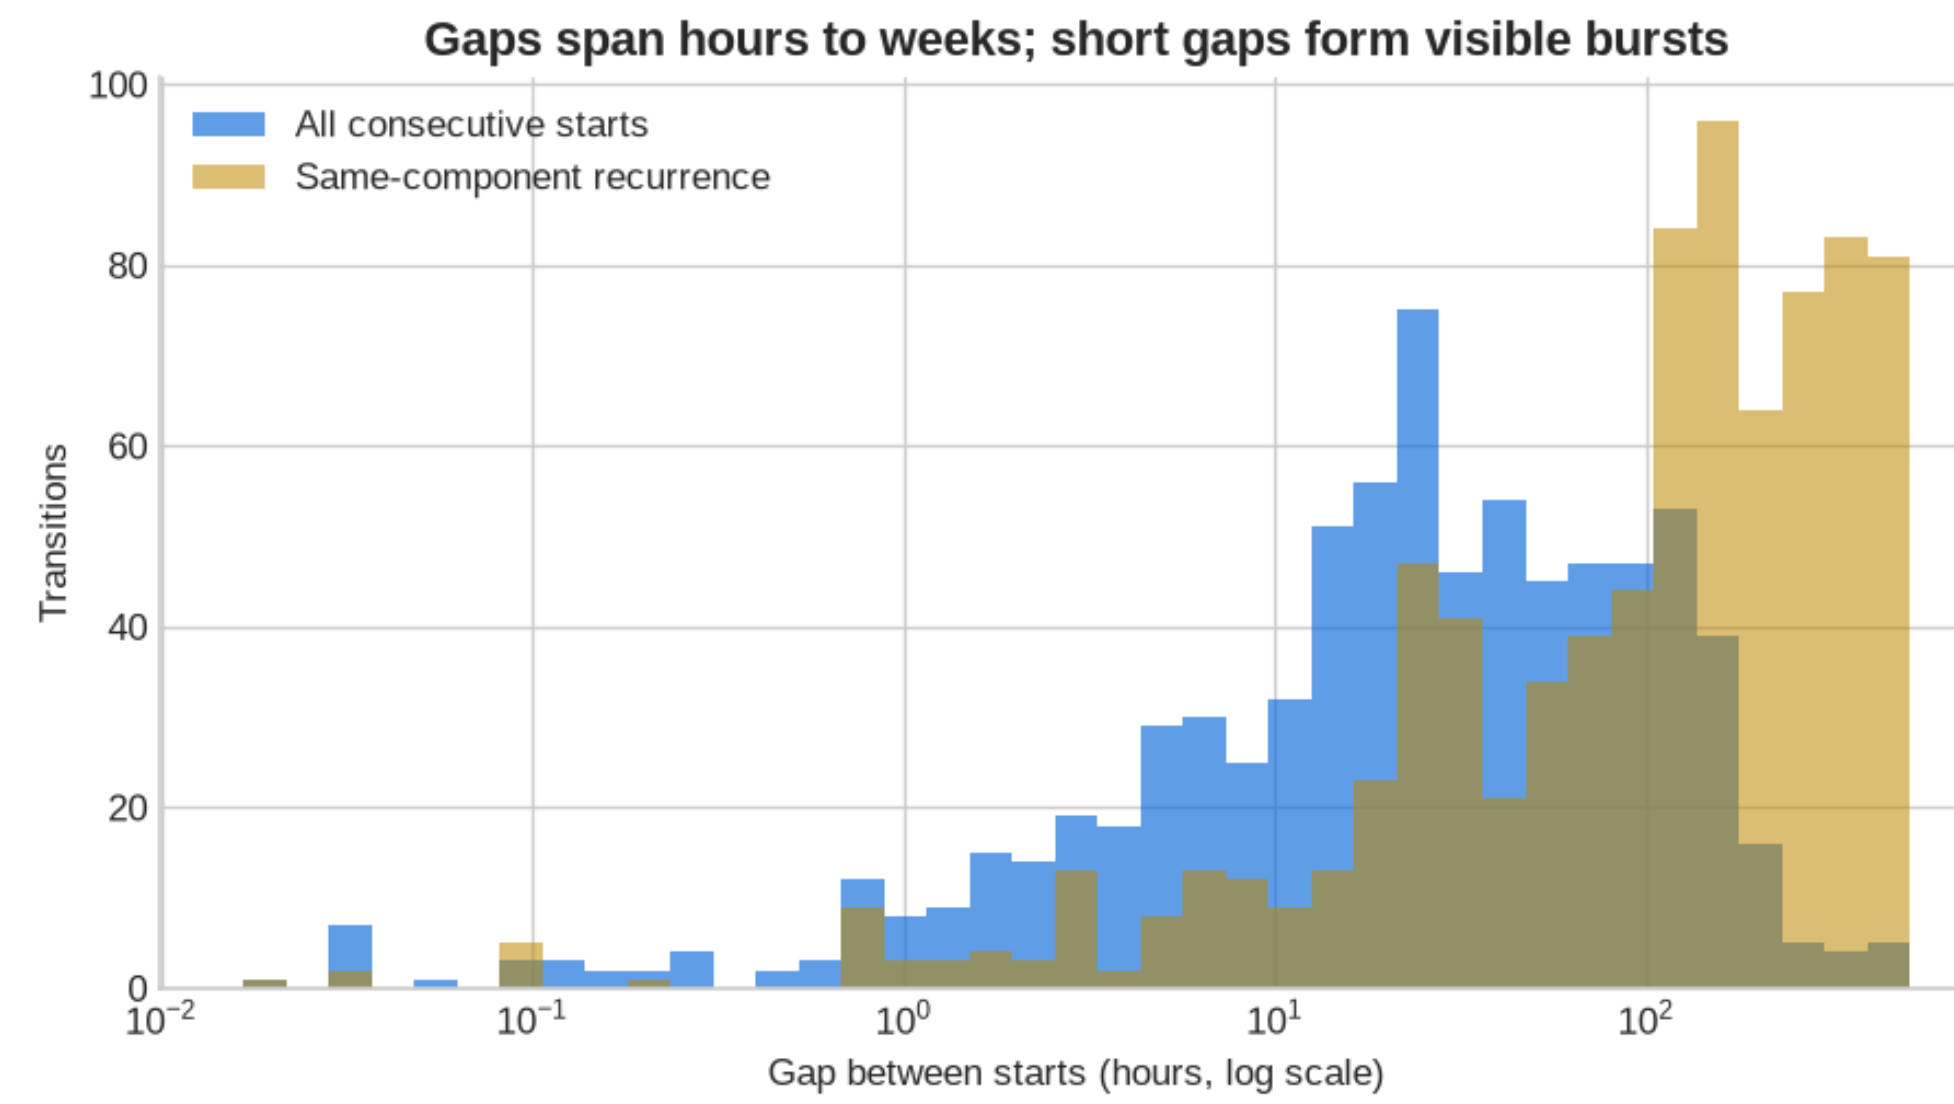
The horizontal axis uses a log scale: equal steps represent ten times as many hours. The two groups contain different numbers of transitions, so bar heights are counts, not comparable percentages.
The chart also shows gaps between incidents affecting the same component. Actions appears in 228 incidents, and 63.4% of its consecutive gaps are seven days or less. For Copilot the figure is 58.8%.
What the archive shows more clearly is how seldom incident windows overlap:
| Number of incidents active at once | Total time |
|---|---|
| Two or more | 80.1 hours |
| Three or more | 6.7 hours |
| Four, the maximum | 39 minutes |
These totals are nested: time with four incidents also counts toward the two-or-more and three-or-more rows.
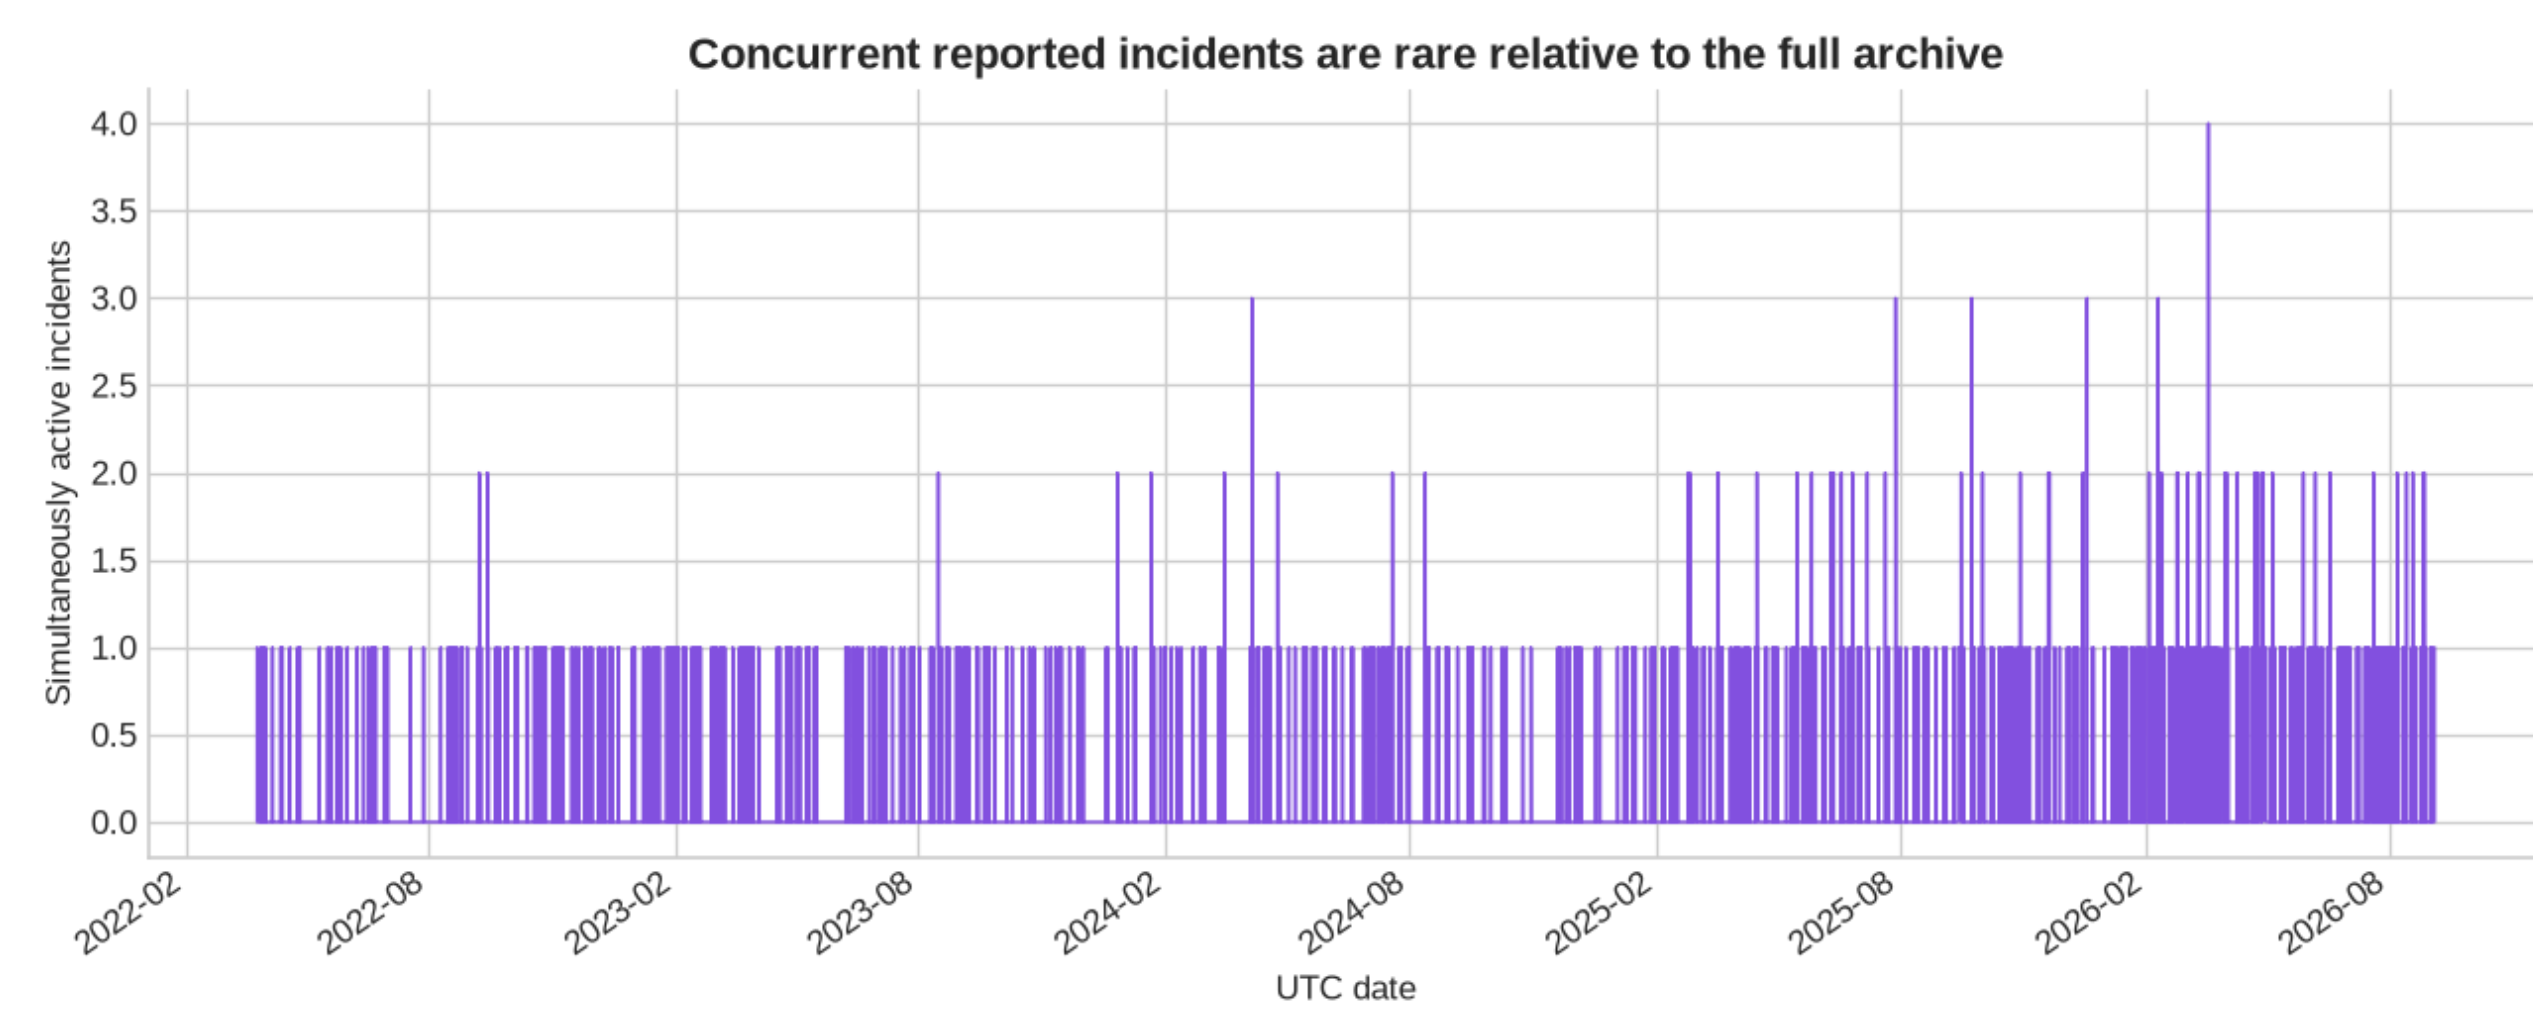
Two or more incidents were active for just 0.21% of the full observation period. The maximum of four happened on March 19, 2026, from 01:05 to 01:44 UTC.
Rare overlap is the reason the two ways of totalling incident time stay close. More on that below.
The reporting language changed too
The most common exact title is:
Disruption with some GitHub services
It appears 112 times, but never before July 16, 2024 in this dataset. In 2025, it accounts for 31.4% of all incidents.
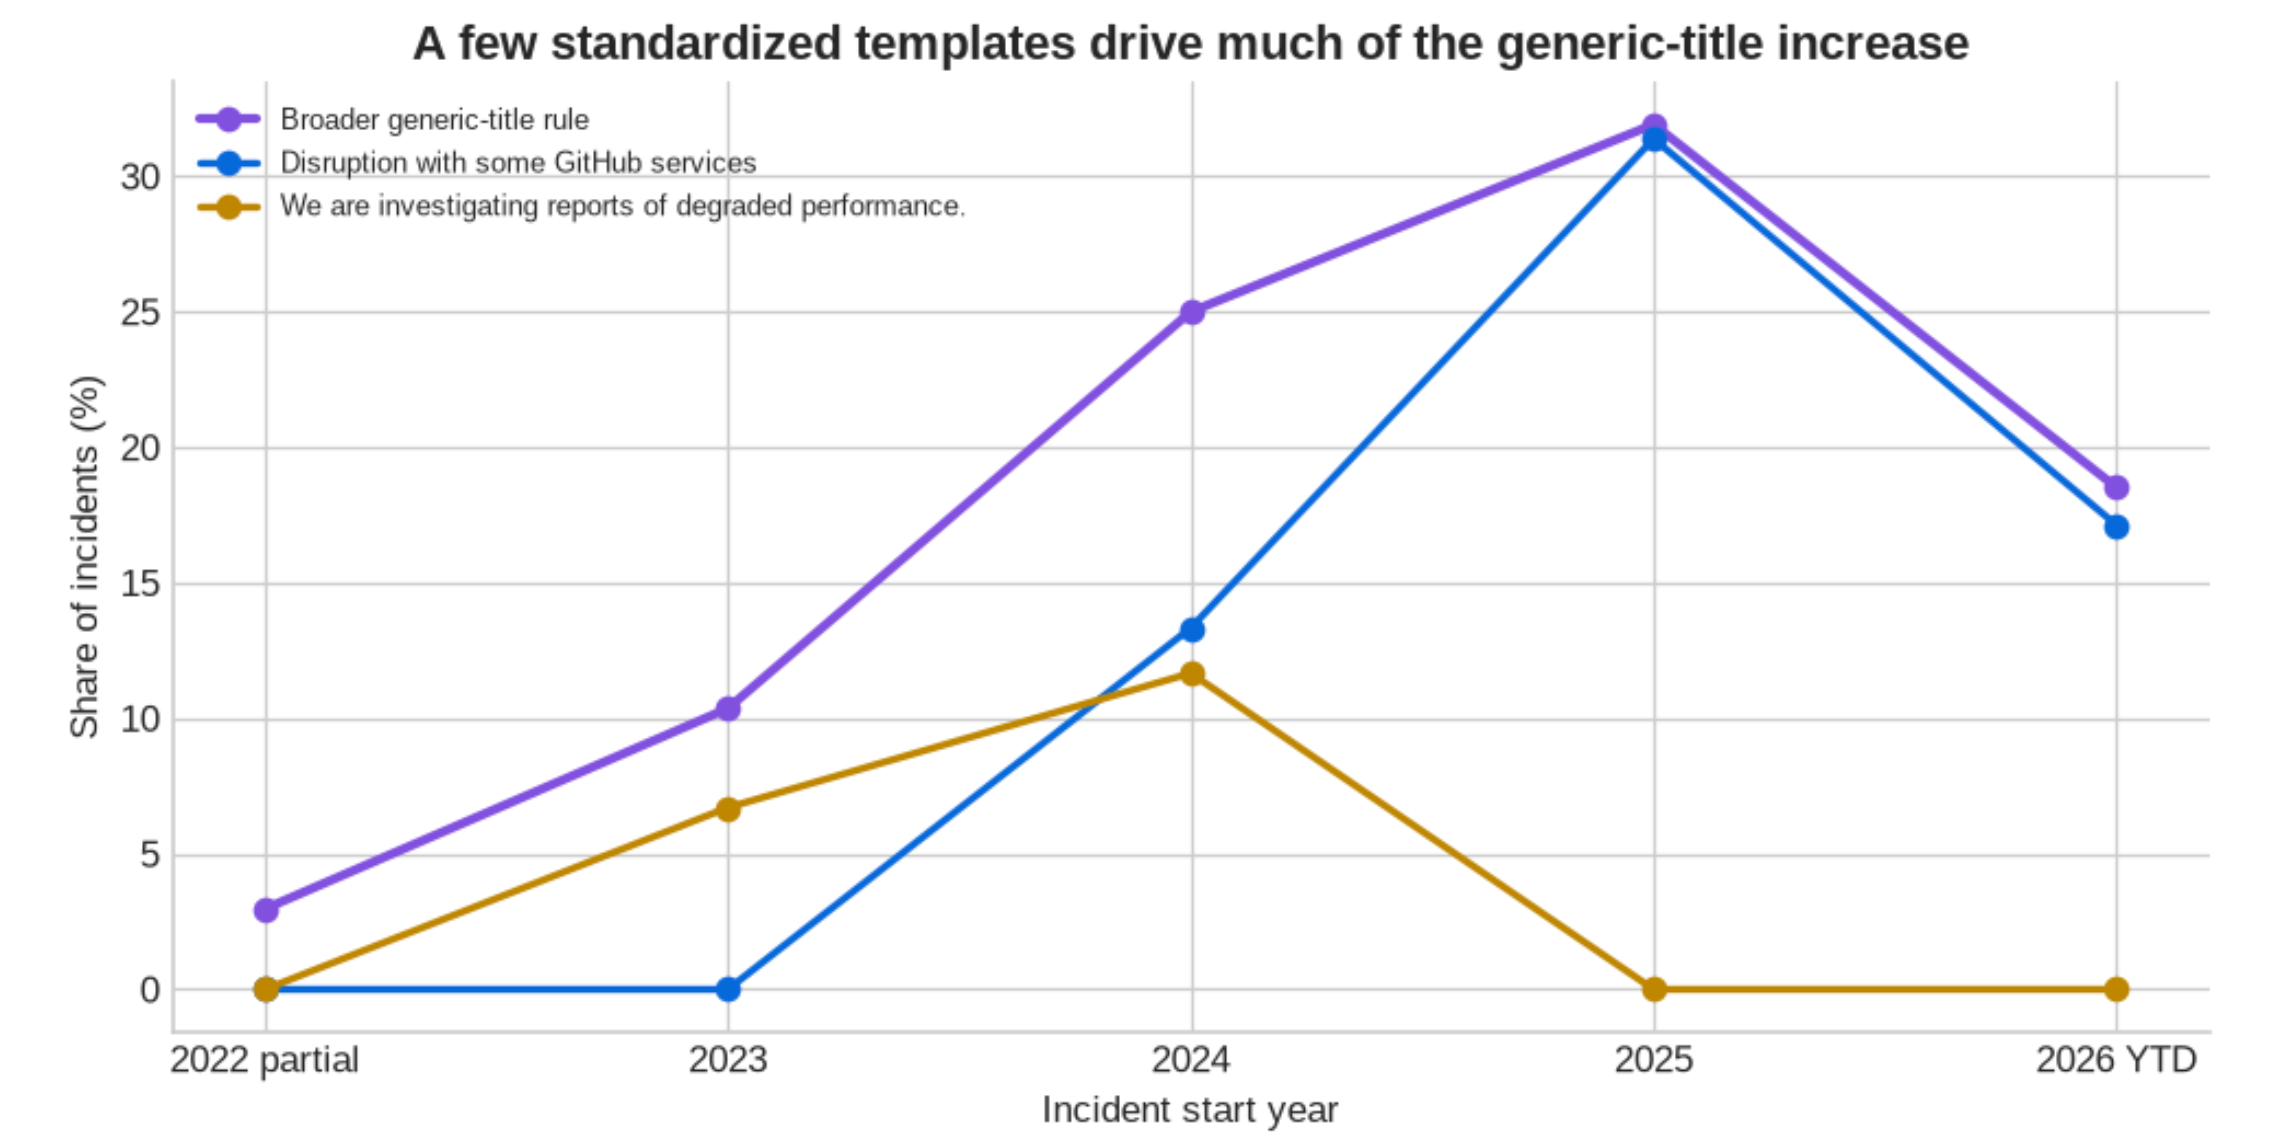
Another template, “We are investigating reports of degraded performance.”, appears 25 times. Together, these two phrases account for more than 91% of incidents classified as having generic titles by my text-matching rule.
Severity labels raise a similar question. Of 27 incidents labelled critical, one is from 2023 and the other 26 are from April through August 2026.
Critical incidents do last longer: their median is 2.02 hours, compared with 1.28 hours for major incidents. But duration alone cannot tell us how many users were affected. A short failure can still be serious.
That is a sharp break in a label, in an archive whose vocabulary demonstrably shifted. It is a good reason to be careful when comparing severity counts across years.
How I counted the hours
Imagine one incident running from 10:00 to 12:00 and another from 11:00 to 13:00.
Adding their durations gives four incident-hours. But at least one incident was active for only three hours.
That distinction changes the real totals:
- Sum of individual incident durations: 1,904.1 hours.
- Time with at least one incident active, after merging overlaps: 1,816.7 hours.
- Double-counted time removed: 87.4 hours.
I merged overlapping windows at their original timestamp precision, then split them across UTC days, hours, and years. A twenty-minute incident contributes twenty minutes, even when it crosses an hour boundary.
The calendar, weekday heatmap, annual active-time shares, and concurrency analysis all use this interval approach.
Data and limits
The source is downtime_windows.csv from mrshu/github-statuses, an unofficial reconstruction of GitHub's public status history. Component information comes from the same repository's incidents.jsonl.
This article uses the notebook run from September 4, 2026, at 12:05:41 UTC. The observation window begins at the earliest valid source timestamp, March 24, 2022, at 19:11 UTC, including records later excluded from the incident analysis.
The raw data contains 830 records. Removing 18 scheduled-maintenance windows and 23 zero-duration records leaves 789 unplanned incidents. The cleaning code also rejects missing, invalid, or negative windows and exact duplicates.
Annual incident counts and duration statistics group incidents by their start year. Annual active time is split at year boundaries. Monthly rates account for the fraction of each calendar month observed. The reported 17.1-hour median gap includes the preceding start when it falls in the previous year; restricting both starts to 2026 gives 17.2 hours.
The notebook's 12 consistency checks passed in this saved run, including checks that daily and hourly active time add up to the merged total. It downloads live source files when rerun, so later runs can produce different numbers.
Several patterns above have explanations this archive cannot test. The weekday differences could come from usage patterns, release schedules, or reporting practices. The sudden appearance of the critical label could reflect a reporting change, a change in impact, or both. GitHub's products and its reporting practices both changed across these four and a half years, and the data cannot separate either from changes in the underlying infrastructure.
The main limits are simple: this is reported incident data from a reconstructed archive; the first and last years are partial; reporting scope may change; and there are no measures of traffic or affected users. Even the timestamps describe reconstructed reporting windows, which may differ from when users first or last experienced a problem.
So, is GitHub getting less reliable?
The strongest answer this dataset supports is that GitHub is reporting incidents much more often. Time with at least one incident active is close to four times its 2024 level. The typical duration moved from about 74 to 89 minutes. The cutoff for the longest 5% rose from about five and a half hours to more than nine.
Turning that into a single platform-wide uptime score would claim more than the data can show. But three things are concrete enough to act on:
- Exposure is concentrated. Tuesday through Thursday afternoons UTC carry most of it. Sunday carries almost none. If you can choose when to run a risky migration or a release that leans on Actions, that choice matters more than it did in 2023.
- Plan for the tail, not the median. Most incidents finish inside 90 minutes, but the longest 1% account for 15.4% of all incident-hours. Retry and fallback logic sized for a few minutes does not cover the case that actually hurts.
- Titles carry less information than they used to. Nearly a third of 2025's incidents shared one generic title. Component metadata from the status feed will tell you more than the headline does.
Explore the analysis
The full Jupyter notebook is on GitHub. It downloads the source files when you run it, so you can rerun the whole analysis against current data.
I wrote it in MLJAR Studio, our editor for working with AI and Python notebooks, and Mercury is what we use to turn notebooks like this one into web apps.
About the Author

Piotr Płoński
Piotr Płoński is a software engineer and data scientist with a PhD in computer science. He has experience in both academia—working on neutrino experiments at leading research labs and collaborating on interdisciplinary projects—and in industry, supporting major clients at Netezza, IBM, and iQor. In 2016, he founded MLJAR to make data science easier and more accessible, creating tools like AutoML, Mercury, and MLJAR Studio.
Related Articles
- 10 ways to make predictions with Machine Learning model
- Build a Web App for your Machine Learning model
- How to Run a Local LLM in 2026
- XGBoost Vector Leaf: Multi-Output Regression Explained
- GitHub Outages, Day by Day: A GitHub-Style Activity Calendar
- 3 New Mercury Widgets for Interactive Python Data Apps
- How Hard Is It to Find a Remote Python Data Job? I Checked 88,975 Hacker News Job Posts
- Are iPhones Really More Expensive? An Inflation-Adjusted Dashboard in Python
- How to Use Jev in Python: Choice, Noul, Score + OpenAI Comparison
- What Is an AI Agent Harness? Definition, Diagrams & Open-Source Examples
Private AI data analysis
AI Data Analyst on Your Computer
Use MLJAR Studio to explore data, discover insights, and create reports with AI.
Runs locally · Your data stays private