
Part 1 — Introduction · 8 min read
What Can We Predict with AutoML?
Classification, regression, probabilities, numeric predictions, and real-world examples.
In the previous chapter, we saw that AutoML runs many experiments for us — trying algorithms, adjusting settings, and comparing results. But before it can run a single experiment, we need to tell it one thing: what kind of answer are we looking for?
Not every prediction is the same shape. Sometimes we want a label — will this customer leave, yes or no? Sometimes we want a number — how much will this house sell for? Getting this right is the first decision in any AutoML project, and it's one only you can make.
Two Kinds of Predictions
Most tabular prediction problems fall into one of two groups.
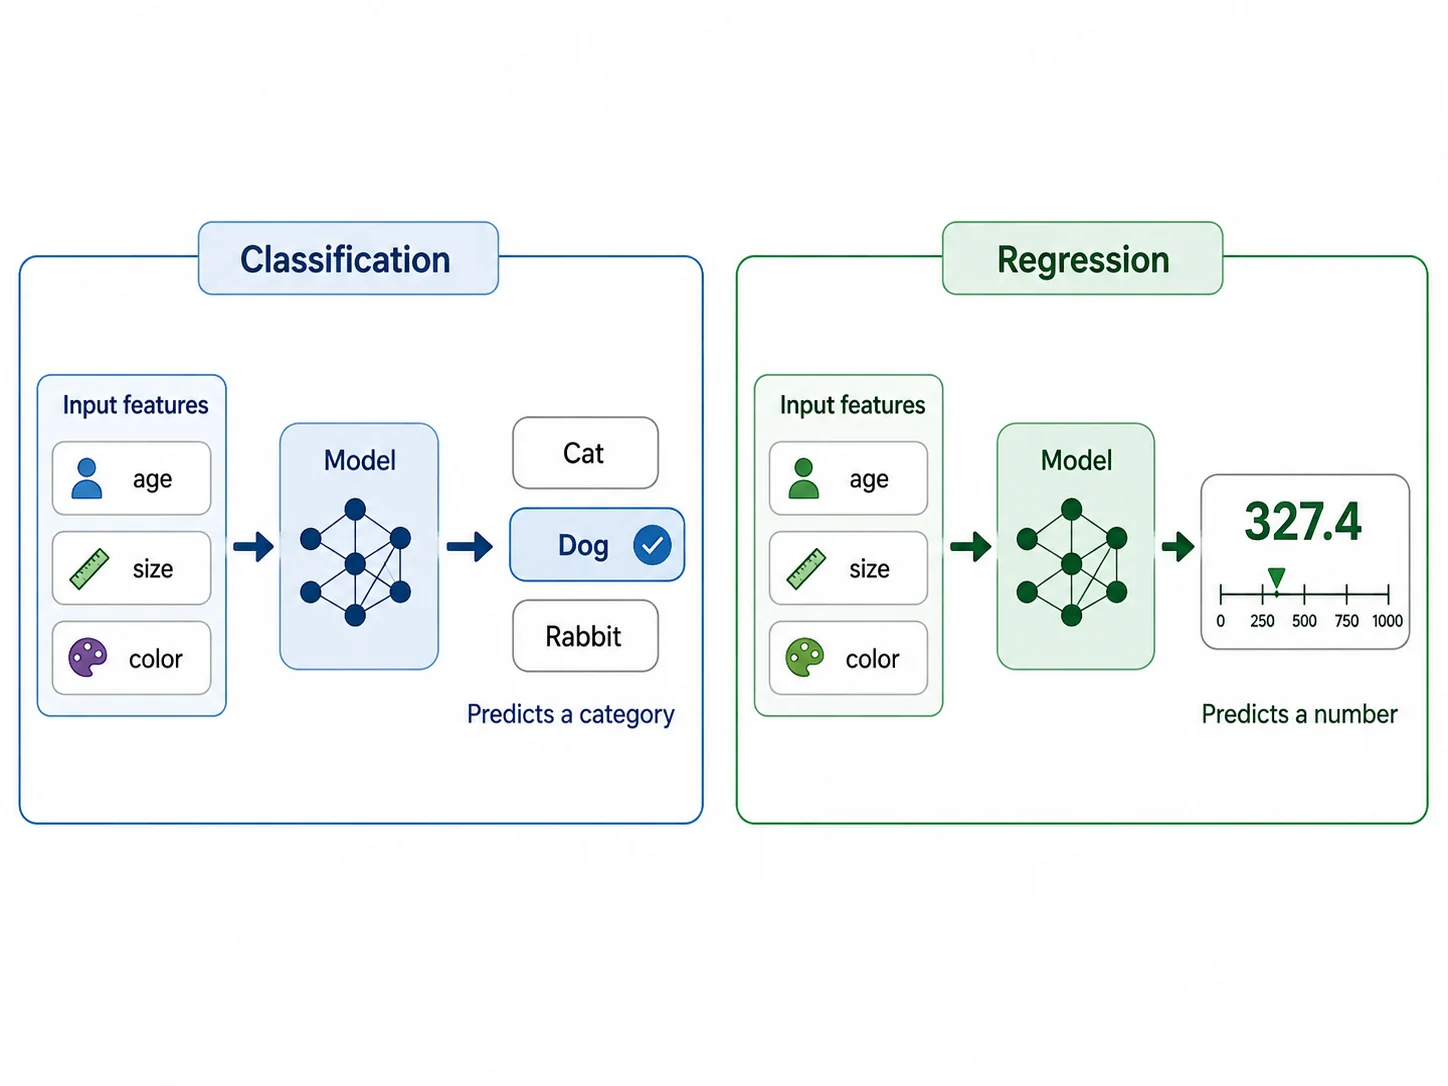
Sometimes we want to predict a category — a label chosen from a fixed set of possibilities. Will this employee stay or leave? Is this wine of low, medium, or high quality? This is called classification.
Other times we want to predict a number that can take a wide range of values — the price of a house, the cost of an insurance claim. This is called regression.
The rest of this chapter looks at each one in turn, along with a third idea — probability — that sits underneath every classification problem.
Classification: Predicting a Category
In classification, the computer learns to sort examples into a fixed set of categories.
Consider employee attrition again, from Chapter 1. Every past employee eventually did one of two things: stayed, or left. Those are the only two possible answers, so this is a binary classification problem — a choice between exactly two categories.
Not every classification problem has just two options. Suppose we want to predict the quality of a wine — low, medium, or high — based on its chemical measurements. Now there are three possible categories instead of two. This is called multi-class classification, and AutoML handles it in much the same way: it still learns to sort each example into one of the available categories, there are just more of them to choose from.
In both cases, the target we're predicting is a label, not a number. "Will leave" and "high quality" aren't quantities — they're categories.
Underneath Classification: Probabilities
Classification models rarely just say "yes" or "no." Underneath, they usually calculate a probability — a number between 0 and 1 that reflects how confident the model is.
Suppose we're predicting whether a customer will subscribe to a product after a marketing call. For one customer, the model might output 0.92 — very likely to subscribe. For another, 0.51 — barely more likely than not. Both would normally be reported as "yes," but they clearly aren't equally certain.
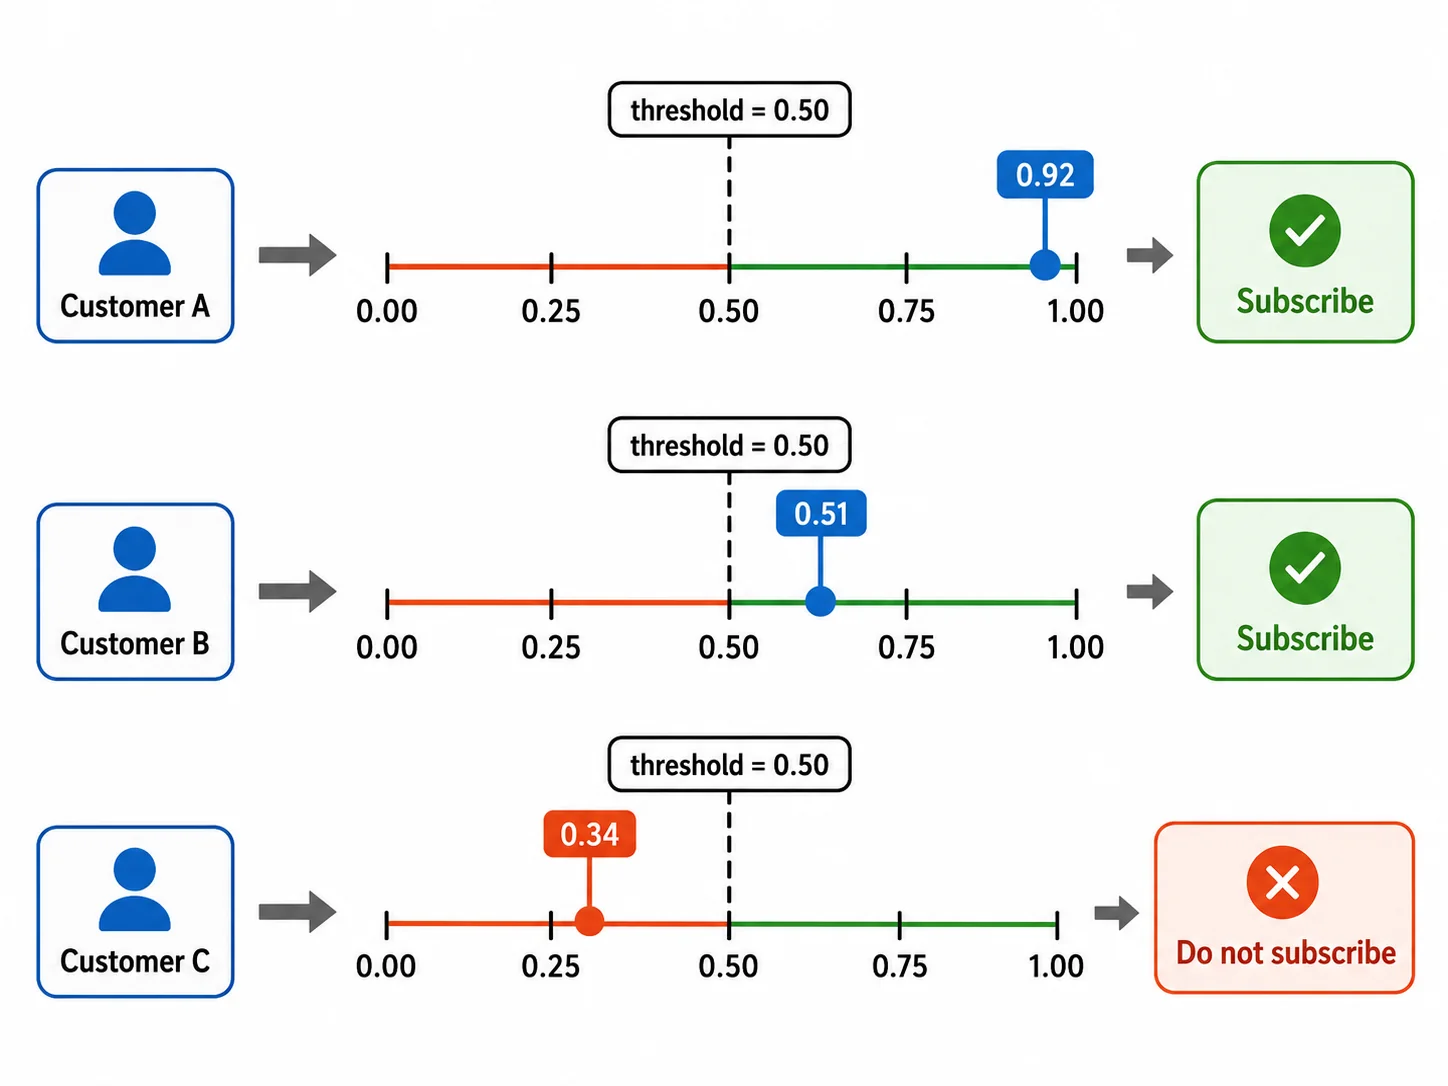
This matters because someone has to decide where the cutoff sits. If we only act on predictions above 0.90, we'll miss the customer at 0.51 who might have said yes. If we act on anything above 0.50, we'll spend time on a lot of customers who say no. Where that line sits isn't something AutoML can decide — it depends on what a missed opportunity costs versus what a wasted call costs, and only you know that.
This is the same idea we met in the last chapter, when we talked about AutoML not being able to decide which mistakes matter most. A probability threshold is where that decision actually gets made.
Regression: Predicting a Number
In regression, the computer learns to predict a number that can fall anywhere within a range, rather than choosing from a fixed set of options.
House prices are the clearest example. A house might sell for $180,000 or $181,450 or $340,000 — there's no fixed list of possible prices to choose from, just a number that could, in principle, be almost anything.
Insurance costs work the same way. Given information about a policyholder, we might want to estimate how much they're likely to cost the insurer over the next year. Like a house price, this is a number without a fixed set of possible values — five hundred dollars, five thousand, or anything in between.
The difference between classification and regression isn't about which problem is harder. It's about the shape of the answer: a label from a short list, or a number from a continuous range.
This Book's Focus — and the Wider AutoML World
This book focuses on classification and regression with tabular data — spreadsheets, CSV files, and the kind of tables most businesses already collect. That's deliberate: it's where AutoML is most mature, and where domain experts without a programming background can get real value fastest.
It's worth knowing, briefly, that AutoML and machine learning cover more ground than this. Forecasting future values over time, recommending products to customers, and spotting unusual or suspicious cases are all active areas, each with their own techniques. We won't cover them in this book, but the underlying idea — learn from examples, then predict — is the same one you're learning here.
It's also worth knowing that you don't always have to train a model from scratch. For images, models like ResNet and EfficientNet have already learned to recognize thousands of everyday objects, and can often be reused directly or lightly adjusted for a new task. For separating an object from its background in an image, Meta's Segment Anything model can do this without being trained specifically on your images at all. For text, models like ChatGPT can summarize, answer questions, and write, without any training data of your own.
These are a different kind of tool than the classification and regression models this book teaches you to build. AutoML searches for a model tailored to your table of data. A pretrained model like the ones above already knows something general — about images, or language — and you borrow that knowledge instead of starting over.
MLJAR Studio actually uses both kinds of tools, for different jobs. Its AI Data Analyst and AI-Assisted Notebook lean on general-purpose models like the text models mentioned above — useful for writing code or making sense of a new dataset. The AutoML experiments this book teaches you to run are a different, more specialized job: finding the best classification or regression model for your specific table. Both are useful. This book is about the second one.
Choosing the Right Type of Prediction
Before starting a project, it helps to ask a few simple questions.
- Is the answer a label chosen from a short list, or a number that could be almost anything? That tells you classification or regression.
- If it's a label, how many possible categories are there — just two, or more?
- Do you need a firm yes-or-no answer, or would a confidence score be more useful for deciding what to do next?
These questions don't require any mathematics. They just require knowing your data and your problem — which is exactly the kind of knowledge AutoML depends on you to bring.
Real-World Examples Across Industries
The table below shows how these ideas map onto real questions across a few industries — including the datasets we'll use throughout this book.
| Industry | Question | Dataset | Prediction Type |
|---|---|---|---|
| HR | Will this employee leave? | Employee Attrition | Classification |
| Real Estate | What will this house sell for? | House Prices | Regression |
| Finance / Marketing | Will this customer subscribe? | Bank Marketing | Classification (with probability) |
| Insurance | What will this claim cost? | Insurance | Regression |
| Policy / Finance | Does this person earn above a threshold? | Adult Income | Classification |
| Quality Control | What quality is this sample? | Wine | Classification (multi-class) |
We'll meet each of these datasets properly in the next part of the book.
Chapter Summary
Every prediction problem has a shape. Classification predicts a category from a fixed list — will this employee leave, is this wine low, medium, or high quality. Regression predicts a number that can fall anywhere in a range — a house price, an insurance cost.
Underneath every classification model is a probability, a measure of confidence rather than a flat yes or no. Deciding where to draw the line between "yes" and "no" is a human decision, not something AutoML can work out on its own.
This book focuses on classification and regression with tabular data, because that's where AutoML is most useful for people without a programming background. Other tools exist for images, text, and other kinds of data — and it's worth knowing they're there, even if we won't use them here.
In the next chapter, we'll step back from the technical ideas for a moment and talk about who this book is for, and how to get the most out of it.
Would you like to follow the book as it grows?
Subscribe through a short Google Form and we'll let you know when a new chapter is ready.