Statistics for Data Science: Essential Concepts
Data science is often associated with machine learning models, neural networks, and artificial intelligence. However, beneath all of these techniques lies a fundamental discipline: statistics. Statistics provides the tools to summarize data, understand uncertainty, and make reliable decisions. Without statistical thinking, machine learning models can easily produce misleading conclusions. In this guide, we will explore the essential statistical concepts for data science, including:
- descriptive statistics
- probability and data distributions
- statistical inference
- correlation and regression
- practical applications using modern tools such as MLJAR
Whether you are starting your journey in data science or strengthening your foundations, these concepts form the core knowledge every data scientist should understand.
Key Takeaways
- Statistics is the foundation of data science. It helps us understand patterns and uncertainty in data.
- Descriptive statistics summarize datasets using measures such as mean, median, and standard deviation.
- Probability distributions describe how data behaves, helping us select appropriate models.
- Statistical inference enables us to draw conclusions from sample data using tools such as hypothesis testing and confidence intervals.
- Correlation and regression help identify relationships between variables and support predictive modeling.
- Modern tools like MLJAR Studio and mljar-supervised automate statistical analysis, making data exploration and machine learning workflows easier.
Understanding these principles will help you build more reliable machine learning models and better data-driven insights.
Why Statistics Matters in Data Science
Every data science project begins with a simple question:
What does the data actually tell us?
Statistics help answer that question. Before building predictive models, data scientists must first understand the structure and behavior of their data. Statistics allows us to summarize large datasets, detect patterns and anomalies, estimate uncertainty, evaluate model performance, and test hypotheses about relationships in the data.
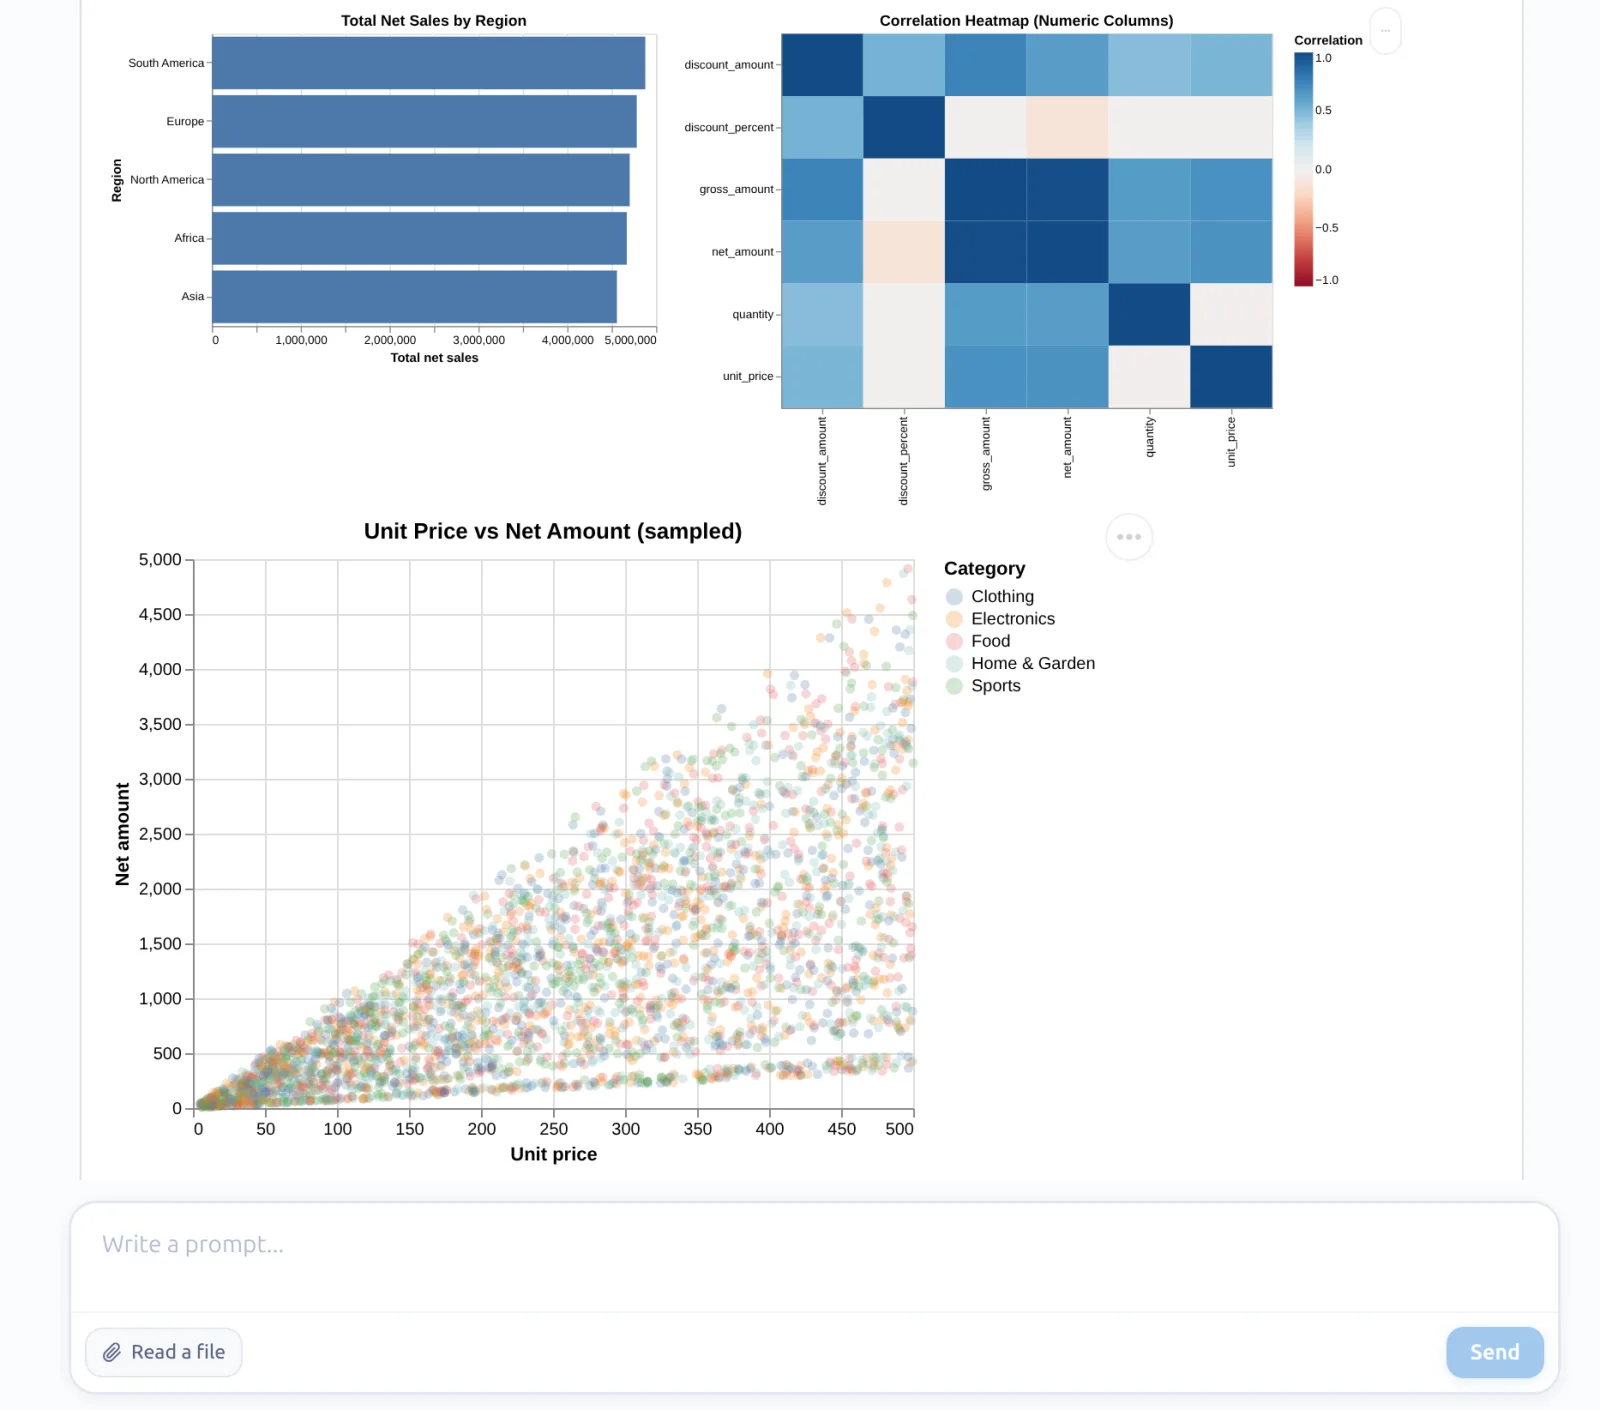
Without statistical analysis, machine learning becomes guesswork. For example, before training a model, a data scientist typically performs exploratory data analysis (EDA). During this process, they examine distributions, correlations, and summary statistics.
Tools like MLJAR Studio automate this process by generating EDA reports that visualize data distributions, correlations, and key statistics. This helps analysts understand their dataset before building models.

Descriptive Statistics
The first step in any data analysis is descriptive statistics. It summarizes the main characteristics of a dataset. Instead of inspecting thousands of rows of data, we compute a few key numbers that describe the dataset.
Measures of Central Tendency
These statistics describe the typical value of a dataset.
Mean
The mean is the average value. Example:
Average monthly sales = $10,000
However, the mean can be influenced by extreme values.
Median
The median is the middle value when data is sorted. It is more robust to outliers. For example, income distributions often use the median instead of the mean.
Mode
The mode is the most frequent value in a dataset. This measure is especially useful for categorical data.
Measures of Dispersion
Dispersion measures describe how spread out the data is.
Variance
Variance measures how far data points are from the mean.
Standard Deviation
Standard deviation is the square root of variance and represents the average distance from the mean.
Example:
Average income = $50,000
Standard deviation = $8,000
This tells us how much variation exists in the dataset.
Example in Python
import pandas as pd

df = pd.read_csv("data.csv")

print(df.describe())
This command produces summary statistics such as: mean, standard deviation, minimum and maximum values, and quartiles. Tools like MLJAR Studio automatically generate similar statistical summaries during exploratory data analysis.
Probability and Data Distributions
Real-world data rarely behaves randomly. Instead, it often follows probability distributions. Understanding distributions helps data scientists choose appropriate statistical models and interpret results.
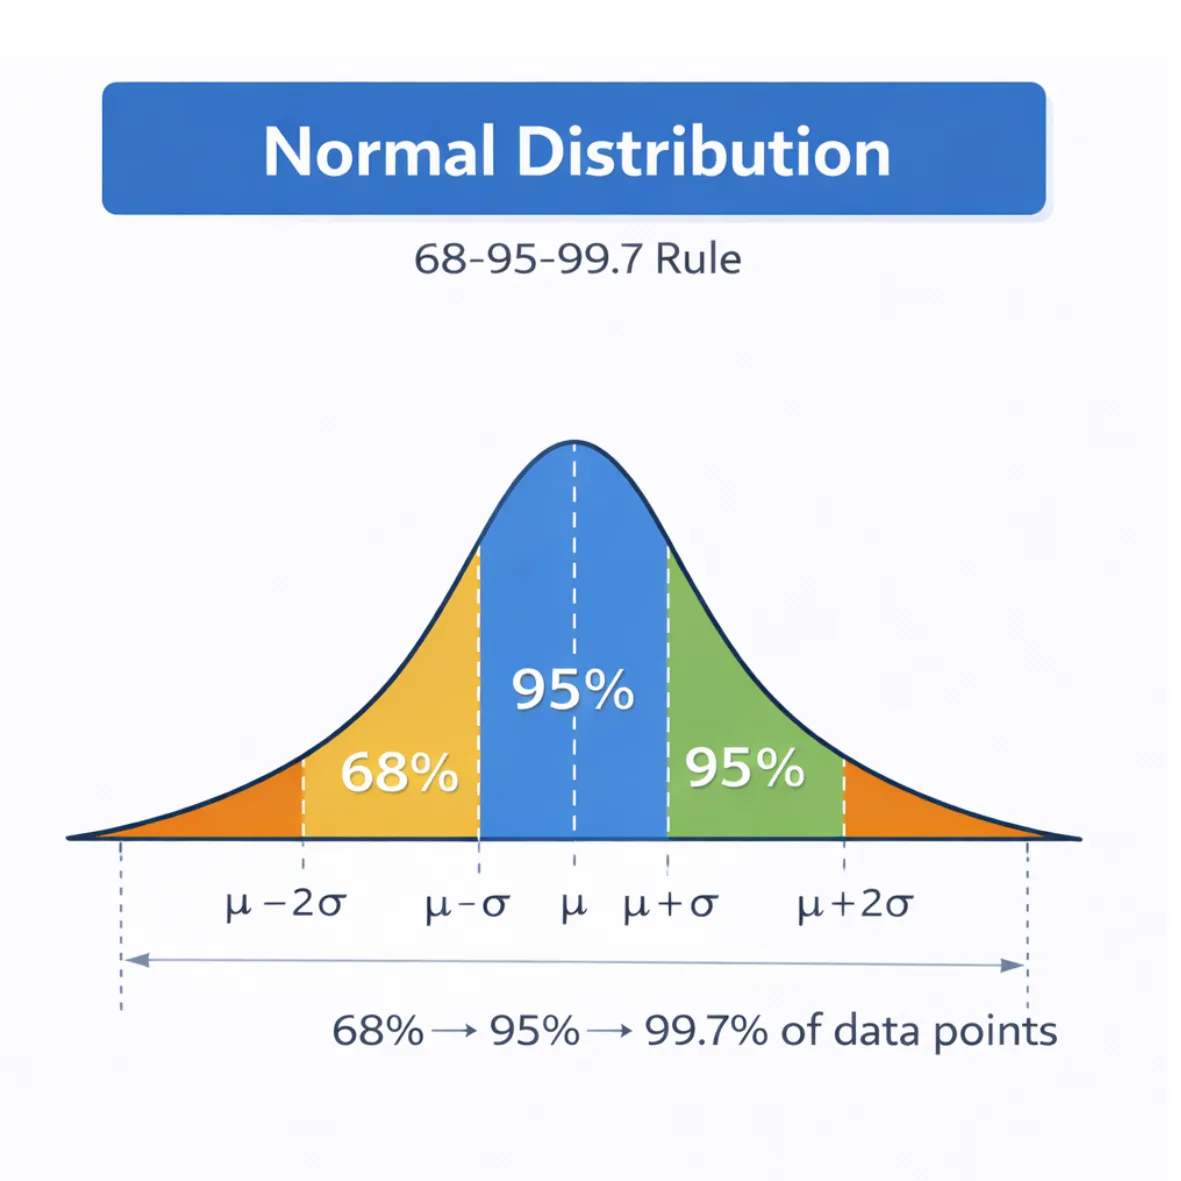
Normal Distribution
The normal distribution (Gaussian distribution) is one of the most important statistical distributions. It has a bell-shaped curve and is defined by two parameters: mean and standard deviation.
The 68–95–99.7 rule states:
- 68% of values fall within one standard deviation of the mean,
- 95% within two standard deviations,
- 99.7% within three standard deviations.
This rule helps data scientists understand variability and detect outliers.
Other Important Distributions
Binomial Distribution. The binomial distribution models events with two possible outcomes: success or failure, yes or no. Example: number of successful purchases from website visitors.
Poisson Distribution. The Poisson distribution models the number of events occurring within a time interval. Examples: number of support tickets per hour or number of website visits per minute.
Understanding these distributions helps analysts select the right statistical tools. Tools such as MLJAR Studio automatically generate histograms and distribution plots to visualize these patterns.
Statistical Inference
Descriptive statistics summarize data.
Statistical inference allows us to draw conclusions about a larger population. Because data scientists rarely have access to the entire population, they work with samples.
Statistical inference helps answer questions such as:
- Is this difference statistically significant?
- Is the observed pattern real or random?
- Can we generalize these results?
Hypothesis Testing
Hypothesis testing evaluates competing explanations.
- Null hypothesis (H₀) - There is no effect.
- Alternative hypothesis (H₁) - There is an effect.
Example:
H₀: A new website layout does not increase conversions
H₁: The new layout improves conversions
A statistical test produces a p-value, which measures how likely the observed results occurred by chance.
If:
p < 0.05
the result is typically considered statistically significant. However, statistical significance does not necessarily mean the effect is practically meaningful.
Confidence Intervals
Confidence intervals provide a range of plausible values for a population parameter.
Example:
Average customer spending = $50
95% confidence interval = $47–$53
This means we are 95% confident that the true population mean lies within this range. Confidence intervals provide more information than a single point estimate.

Correlation and Regression
Data scientists often want to understand relationships between variables. Two key statistical tools are: correlation and regression.
Correlation
Correlation measures the strength of a relationship between two variables.
The Pearson correlation coefficient ranges from:
- -1 (perfect negative correlation)
- 0 (no correlation)
- 1 (perfect positive correlation)
However, an important principle applies:
Correlation does not imply causation.
Two variables may be correlated because of a third factor.

Linear Regression
Regression models relationships between variables.
A simple linear regression model is written as:
y = a + bx
Where:
- y = dependent variable
- x = independent variable
- b = slope
Regression helps answer questions such as:
- How does advertising spending affect sales?
- How does house size affect property value?
Statistics vs Machine Learning
Many beginners ask: What is the difference between statistics and machine learning? Although closely related, they have slightly different goals.
| Statistics | Machine Learning |
|---|---|
| Focuses on understanding data | Focuses on prediction |
| Emphasizes interpretability | Emphasizes performance |
| Often uses statistical models | Uses algorithms and optimization |
| Typically smaller datasets | Often large datasets |
Machine learning builds on statistical ideas. Algorithms such as linear regression, logistic regression, and Bayesian models originate directly from statistics. For example, when training models using mljar-supervised, the AutoML engine evaluates models statistically by comparing metrics such as accuracy, RMSE, and cross-validation scores. Statistics explains why models behave the way they do, while machine learning focuses on predictive performance.
Statistics in Modern Data Science Tools
Modern tools automate many statistical tasks. For example, mljar-supervised simplifies machine learning workflows by automating:
- model training,
- hyperparameter tuning,
- model evaluation,
- report generation.
Behind the scenes, the system performs statistical analysis such as:
- feature importance analysis,
- cross-validation,
- performance evaluation,
- model comparison.
MLJAR Studio integrates these capabilities with notebooks, visualizations, and AI assistants to support interactive data analysis. These tools make statistical workflows easier, but understanding the underlying principles remains essential.
Common Statistical Mistakes in Data Science
Even experienced analysts can misinterpret statistical results. Here are some common mistakes.
- confusing correlation with causation - two variables may move together without one causing the other;
- ignoring sample size - small samples often produce unreliable results;
- overfitting models - models that perfectly fit training data often perform poorly on new data - cross-validation helps avoid this problem;
- misinterpreting P-values - small p-value does not prove a hypothesis is correct.
It only indicates that the observed result is unlikely under the null hypothesis.
Frequently Asked Questions
What statistics should every data scientist know?
Every data scientist should understand descriptive statistics, probability distributions, hypothesis testing, confidence intervals, correlation analysis, and regression models.
These concepts help interpret data and evaluate machine learning models.
Why is statistics important in data science?
Statistics allows data scientists to summarize data, understand uncertainty, detect patterns, and validate results. It forms the foundation for machine learning and predictive modeling.
What is the difference between descriptive and inferential statistics?
Descriptive statistics summarize the characteristics of a dataset using metrics such as mean and standard deviation.
Inferential statistics allows analysts to draw conclusions about a population using sample data.
What is statistical significance?
Statistical significance indicates whether an observed effect is unlikely to occur by chance. It is typically measured using p-values in hypothesis testing.
How does MLJAR help with data science?
MLJAR provides tools such as MLJAR Studio and mljar-supervised that automate exploratory data analysis, machine learning model training, and model evaluation.
Conclusion
Statistics is the foundation of data science. Understanding statistical concepts allows data scientists to interpret data correctly, evaluate uncertainty, design reliable experiments and build trustworthy machine learning models.
Key concepts include descriptive statistics, probability distributions, statistical inference, correlation, and regression.
Modern tools like MLJAR Studio and mljar-supervised help automate many parts of the workflow, but the underlying statistical principles remain essential. For anyone working with data, learning statistics is one of the most valuable investments you can make.
Explore next
Continue with practical guides, tutorials, and product workflows for Python, AutoML, and local AI data analysis.
- AI Data Analyst
Analyze local data with conversational AI support and notebook-based, reproducible Python workflows.
- AutoLab Experiments
Run autonomous ML experiments, track iterations, and inspect results in transparent notebook outputs.
- MLJAR AutoML
Learn how to train, compare, and explain tabular machine learning models with open-source automation.
- Machine learning tutorials
Step-by-step guides for beginners and practitioners working with Python, AutoML, and data workflows.
Run AI for Machine Learning — Fully Local
MLJAR Studio is a private AI Python notebook for data analysis and machine learning. Generate code with AI, run experiments locally, and keep full control over your workflow.
About the Author

Related Articles
- Zbuduj lokalnego czata AI w Pythonie - Mercury + Bielik LLM krok po kroku
- Build chatbot to talk with your PostgreSQL database using Python and local LLM
- Build a ChatGPT-Style GIS App in a Jupyter Notebook with Python
- Private PyPI Server: How to Install Python Packages from a Custom Repository
- Essential Python Libraries for Data Science (2026 Guide)
- Machine Learning Basics: Beginner’s Guide 2026
- Machine Learning vs AI vs Data Science: What’s the Difference? (Complete Guide)
- AI Ethics and Responsible Data Science: Building Fair and Private Machine Learning Systems
- Local vs Cloud Data Processing: Security, Privacy, and Private AI Workflows
- AutoResearch by Karpathy and the Future of Autonomous AI Research