CatBoost with custom evaluation metric
 CatBoost is a powerful gradient boosting framework. It can be used for classification, regression, and ranking. It is available in many languages, like: Python, R, Java, and C++. It can handle categorical features without any preprocessing. As all gradient boosting algorithms it can overfit if trained with too many trees (iterations). If the number of trees is too small, then we will observe underfit. To find the optimal number of trees the early stopping can be applied. This technique observes the evaluation metric on the separate dataset (from training).
CatBoost has many evaluation metrics built-in:
- evaluation metrics for binary classification: docs,
- evaluation metrics for multiclass classification: docs,
- evaluation metrics for regression: docs.
Although there are many metrics, sometimes there might be a situation that you would like to monitor an evaluation metric that is not available, in such situation you can write your own custom evaluation metric. In this post, I will show you how to do this.
Loss function vs. objective vs. evaluation metric
There can be defined two functions in the CatBoost:
- loss function that is used for tree building (for training), it needs to be differentiable,
- evaluation metric that is used in early stopping for overfitting detection. It doesn't need to be differentiable.
The loss function is sometimes called the objective. In this post, we will set a custom evaluation metric.
Class for custom eval_metric
In the CatBoost the evaluation metric needs to be defined as a class with three methods:
get_final_error(self, error, weight),is_max_optimal(self),evaluate(self, appoxes, target, weight).
In this post, we will create custom evaluation metric for computing Pearson correlation between predictions and target values. The code to compute correlation as a custom metric:
class CatBoostEvalMetricPearson(object):
    def get_final_error(self, error, weight):
        return error

    def is_max_optimal(self):
        # the larger metric value the better
        return True

    def evaluate(self, approxes, target, weight):
        assert len(approxes) == 1
        assert len(target) == len(approxes[0])
        preds = np.array(approxes[0])
        target = np.array(target)
        return np.corrcoef(target, preds)[0, 1], 0
Example training of CatBoost with custom eval_metric
Let's create a working example with a toy dataset. To generate the dataset, we will use make_regression() from a scikit-learn package.
import numpy as np
from catboost import CatBoostRegressor, Pool
from sklearn.datasets import make_regression
from sklearn.model_selection import train_test_split
from matplotlib import pyplot as plt
import matplotlib
matplotlib.rcParams.update({'font.size': 14})


# generate data
X, y = make_regression(n_samples=100, n_features=10, n_informative=5)
X_train, X_validation, y_train, y_validation = train_test_split(X, y,
                                      test_size=0.25, random_state=42)
When creating the CatBoost model we need to set the eval_metric. It can be a string in the case of a built-in metric. For custom metric we pass there an object of the class CatBoostEvalMetricPearson. In the fit() method we need to pass eval_set - an additional data that will be used for evaluation metric monitoring.
model = CatBoostRegressor(
    iterations=100,
    learning_rate=0.05,
    eval_metric=CatBoostEvalMetricPearson()
)

model.fit(
  X_train,
  y_train,
  eval_set=Pool(
    data=X_validation,
    label=y_validation
  )
)
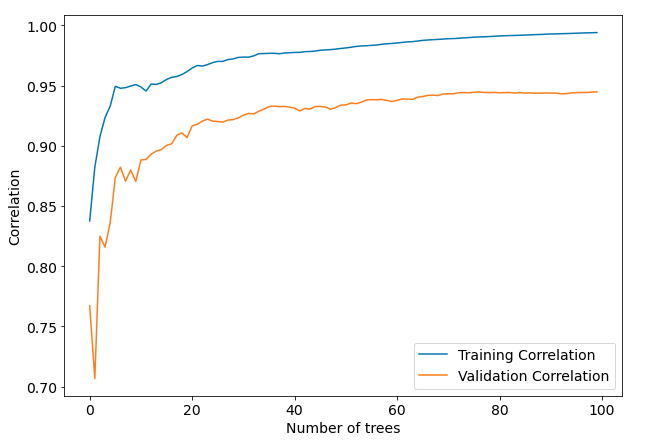
After the training, we can access the metric values from each iteration by accessing the evals_result_ variable from the CatBoostRegressor object. Please notice that to get metric values we use the class name as a string "CatBoostEvalMetricPearson". We get learning curves by plotting evaluation metric values.
plt.figure(figsize=(10,7))
plt.plot(model.evals_result_["learn"]["CatBoostEvalMetricPearson"], label="Training Correlation")
plt.plot(model.evals_result_["validation"]["CatBoostEvalMetricPearson"], label="Validation Correlation")
plt.xlabel("Number of trees")
plt.ylabel("Correlation")
plt.legend()
The learning curves for training and testing sets with Pearson correlation:
Summary
The CatBoost algorithm has many built-in evaluation metric. In the case of a special metric, it can be easily added by creating a custom class.
In the MLJAR AutoML package (available at GitHub) there are many evaluation metrics available:
- for binary classification: 'logloss', 'auc', 'f1', 'average_precision', or 'accuracy',
- for multiclass classification: 'logloss', 'f1', or 'accuracy',
- for regression: 'rmse', 'mse', 'mae', 'r2', 'mape', 'spearman', or 'pearson'.
You can easily select evaluation metric by setting
eval_metricinAutoML()constructor:
automl = AutoML(mode="Compete", eval_metric="f1")
automl.fit(X, y)
You can check details of different metrics implementation in this file: link to metric.py.
AI Data Analyst on Your Computer
Use MLJAR Studio to explore data, find insights, and create reports with AI. Everything runs locally, so your data stays with you.
About the Author

Related Articles
- How does AutoML work?
- Machine Learning for Lead Scoring
- MLJAR AutoML adds integration with Optuna
- How to save and load Xgboost in Python?
- How to use early stopping in Xgboost training?
- The next-generation of AutoML frameworks
- MLJAR Studio a new way to build data apps
- Read Google Sheets in Python with no-code MLJAR Studio
- How to authenticate Python to access Google Sheets with Service Account JSON credentials
- Python Virtual Environment Explained