AutoML can feel like magic at first. You give data, select a target, and you get a trained machine learning model.
But for beginners, the real question is simple: what is machine learning, and how do I start?
In this tutorial, we will go step by step. We start from the basics, then move to AutoML, and finally build a real model for predicting house prices. Everything will be done in Python, using open-source MLJAR AutoML.
If you are looking for the short answer: AutoML in Python helps you train, compare, and explain multiple models automatically from tabular data. In this guide, you will build a real house price prediction model with MLJAR AutoML, evaluate it, and understand the report.
Tutorial outline
- What is AutoML in Python?
- Why use AutoML for house price prediction?
- Machine Learning vs AutoML: key differences for beginners
- How to use AutoML in Python: script, notebook, or MLJAR Studio
- Problem setup: house prices prediction
- AutoML Python example: house price regression script
- How to evaluate AutoML regression results (MSE, R², RMSE)
- FAQ: AutoML in Python for beginners
What is AutoML in Python?
Machine Learning (ML) is a way to teach computers to make predictions from data.
Instead of writing rules step by step, we show the computer examples.
For example, we can give information about houses, like size, location, and number of rooms. We also give the price of each house. The model learns how these things are connected.
After learning, it can look at a new house and predict its price.
In simple words, machine learning means learning patterns from data.
Why use AutoML for house price prediction?
Building a machine learning model is not just one simple step. There are many things to do. We need to prepare the data, choose a model, train it, tune its parameters, and check if it works well.
For beginners, this can feel difficult and sometimes confusing.
This is why AutoML is helpful.
AutoML means Automated Machine Learning. It helps you do most of the work automatically. It can try many models, tune them, compare results, and create reports.
Instead of focusing on all technical details, you can focus on understanding your data and your problem.
In simple words, AutoML helps you go from data to a working model much faster.
Machine Learning vs AutoML: key differences for beginners
With machine learning, you usually build everything step by step on your own. With AutoML, the system helps you do most of the steps automatically. AutoML does not replace learning. It helps you learn faster and get results sooner.
How to use AutoML in Python: script, notebook, or MLJAR Studio
There are a few simple ways to use AutoML in Python. It depends on how you like to work.
Some people prefer writing code in a Python script. This is a good choice when you want something simple and repeatable. You can run the script again later and get the same results.
Some people prefer working in a Jupyter Notebook. This is very popular for beginners. You can run code step by step, see outputs immediately, and add your own notes. It is a great way to learn and explore data.
There are also tools like MLJAR Studio. It gives you a notebook environment, but also adds helpful features.
One important feature is the AI Data Analyst. It can do the work for you. You can describe what you want, and it will prepare the code, run AutoML, and show you the results.
In this tutorial, we will keep things simple. We will show Python code that you can run in a Python script or in a Jupyter Notebook. This can be JupyterLab or MLJAR Studio.
This way, you can start with code and later explore more advanced and interactive ways of working.
Problem setup: house prices prediction
In this tutorial, we will solve one simple problem.
We want to predict house prices.
This is called a regression task, because the result is a number. In this case, the number is the price of a house.
We will use the California housing dataset from scikit-learn.
We are not loading data from a file here. This dataset is already built into scikit-learn, so we can use it directly. This makes it very convenient for learning and experiments.
Let’s start by loading the data and displaying it as a DataFrame.
import pandas as pd
from sklearn.datasets import fetch_california_housing

data = fetch_california_housing(as_frame=True)

df = data.frame
df.head()
When you run this code, you will see the first few rows of the dataset.
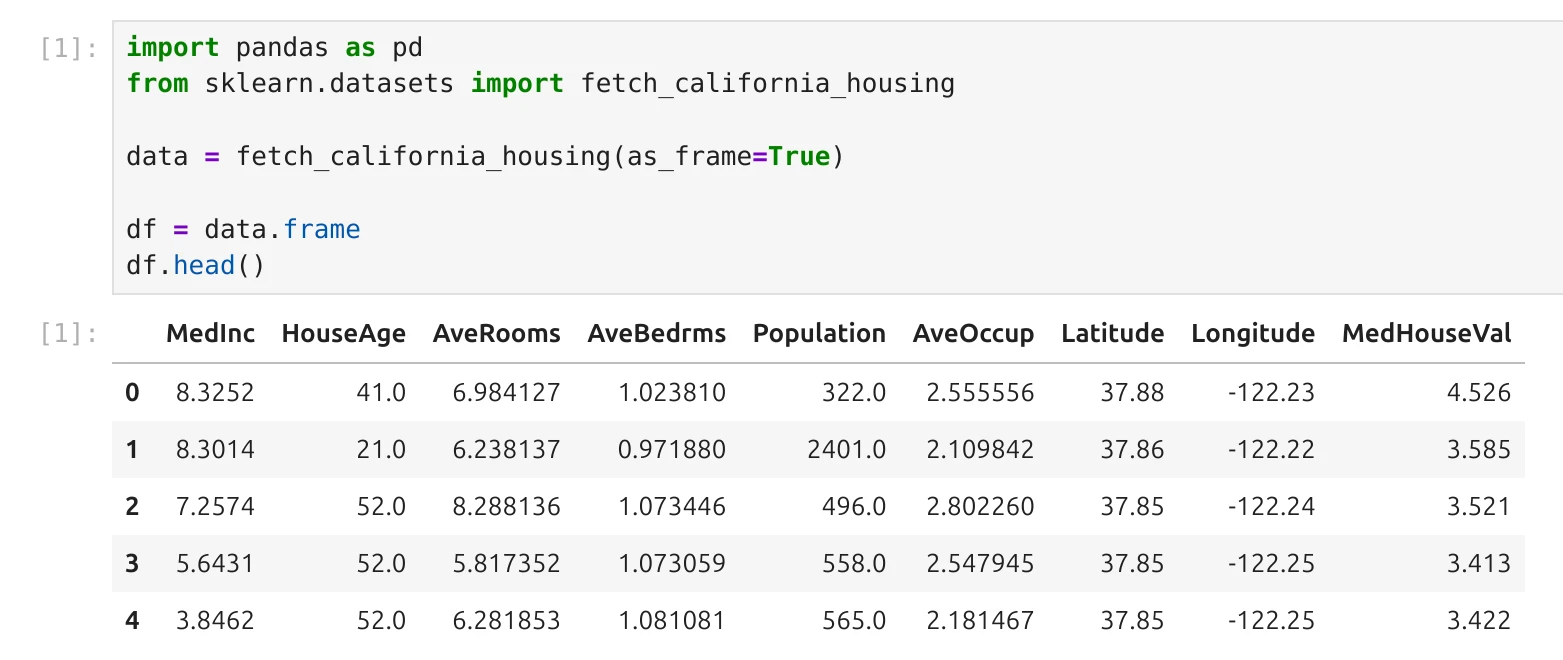
Each row is like a small data card.
Let’s look at the first row as an example.
This data card has the following values:
- The median income (MedInc) is
8.3252. - The house age (HouseAge) is
41years. - The average number of rooms (AveRooms) is about
6.98. - The average number of bedrooms (AveBedrms) is about
1.02. - The population is
322people (total number of people living in a given area.). - The average occupancy (AveOccup) is about
2.56people per household. - The location is given by latitude
37.88and longitude-122.23.
And finally, the most important value:
- The house price (MedHouseVal) is
4.526.
It is important to understand that this value is given in units of 100,000 dollars.
So 4.526 means 452,600 dollars.
This is the value we want to predict.
Our goal is simple.
We want to train a machine learning system that looks at all these values and learns how they are connected to the price.
Later, when we give it a new data card without a price, it should be able to estimate it.
AutoML Python example: house price regression script
Now we are ready to train our first model.
We already understand the data, so the next step is to split it into two parts.
One part will be used for training the model, and the second part will be used to check how well the model works on new data.
from sklearn.model_selection import train_test_split

X = df.drop(columns=["MedHouseVal"])
y = df["MedHouseVal"]

X_train, X_test, y_train, y_test = train_test_split(
    X, y, test_size=0.2, random_state=42
)
Now we can use AutoML.
from supervised.automl import AutoML

automl = AutoML(
    mode="Explain",
    results_path="AutoML_house_prices"
)

automl.fit(X_train, y_train)
We are using Explain mode because it not only trains models, but also creates explanations. It will show which features are important and how they affect predictions.
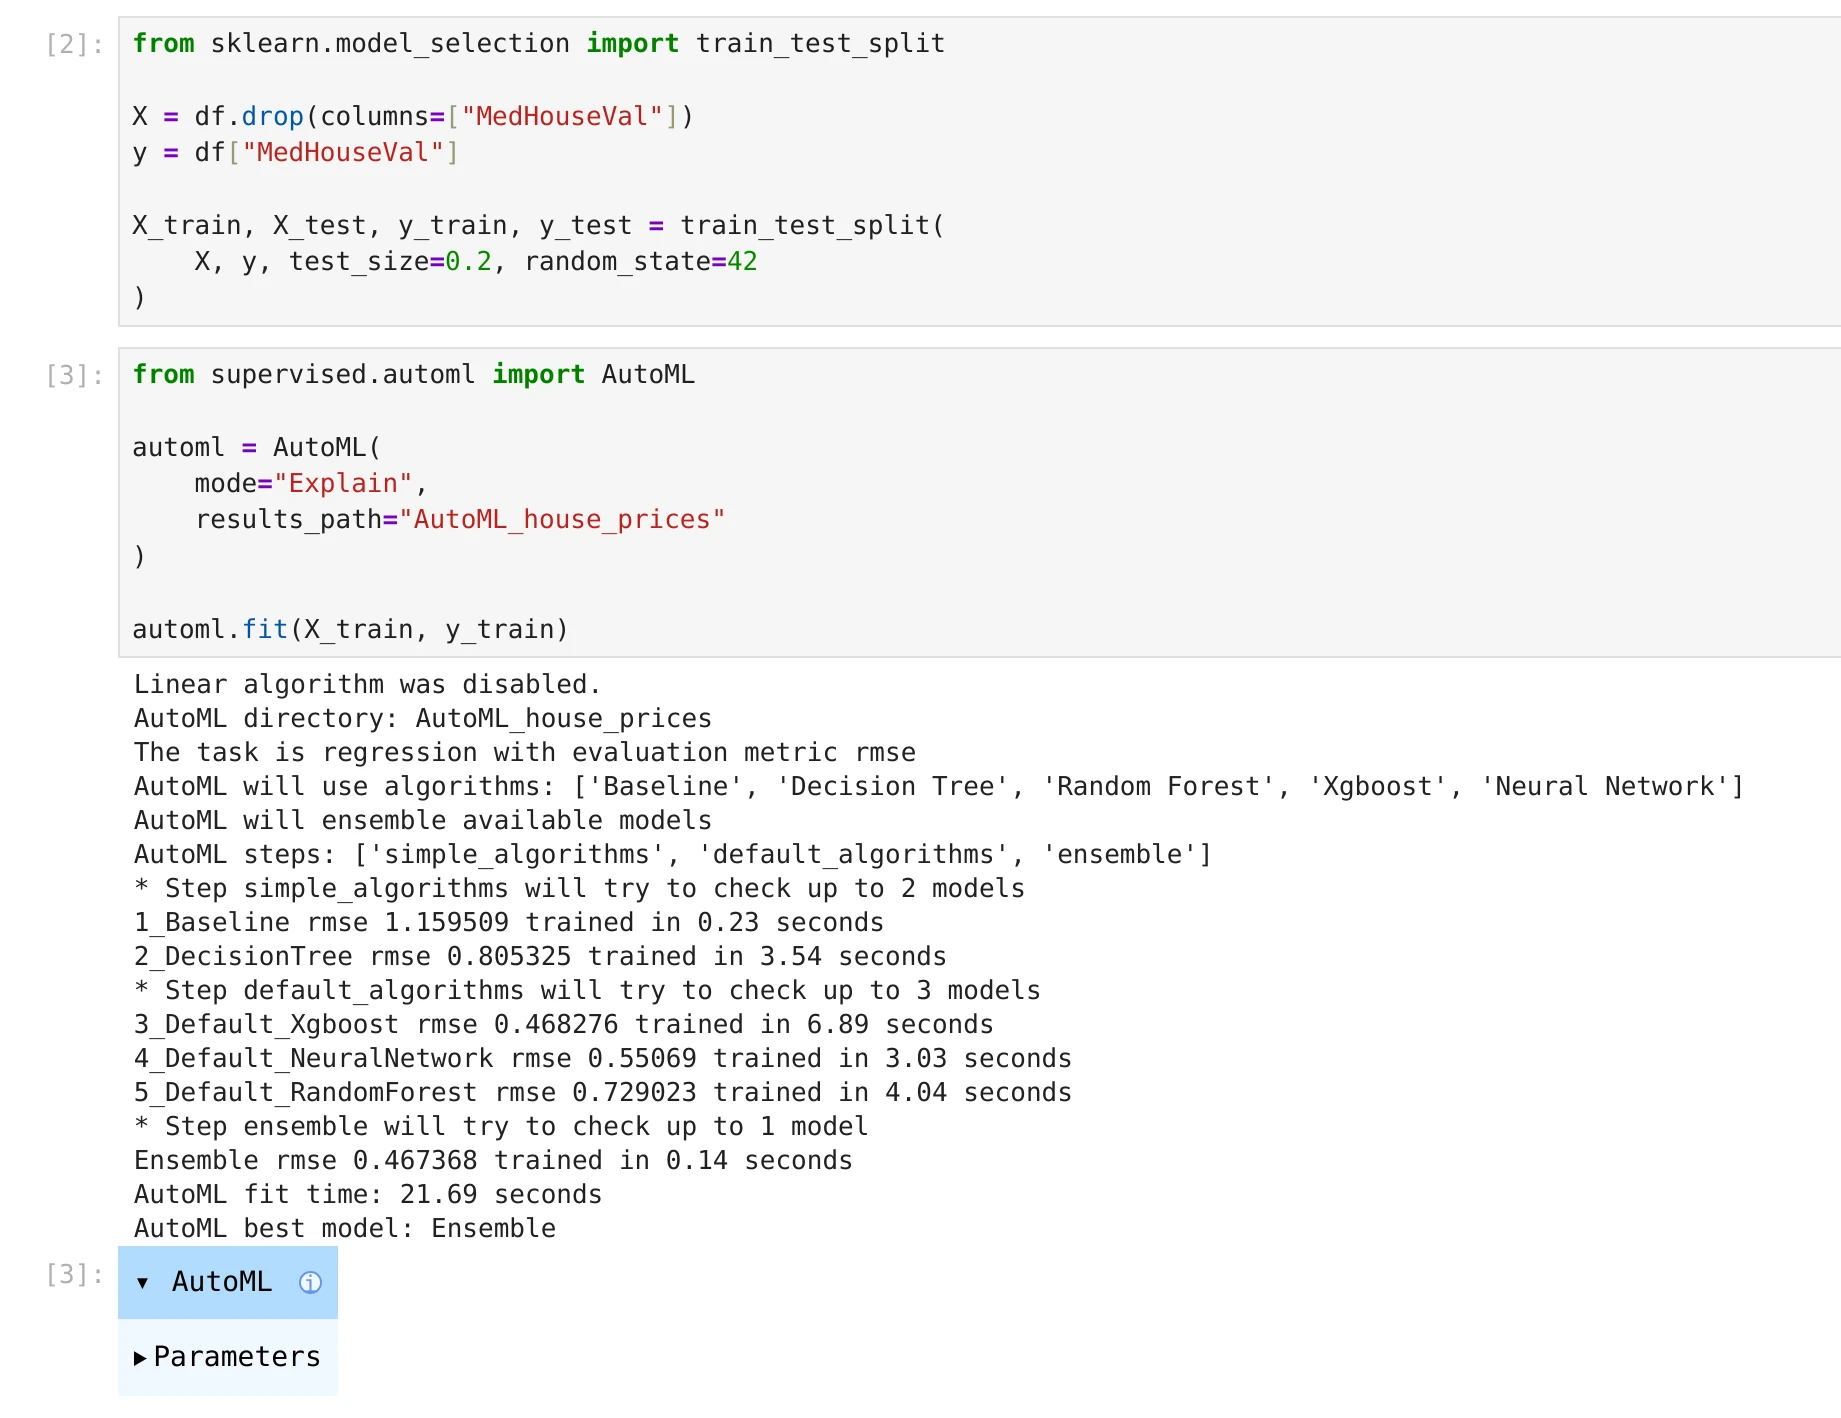
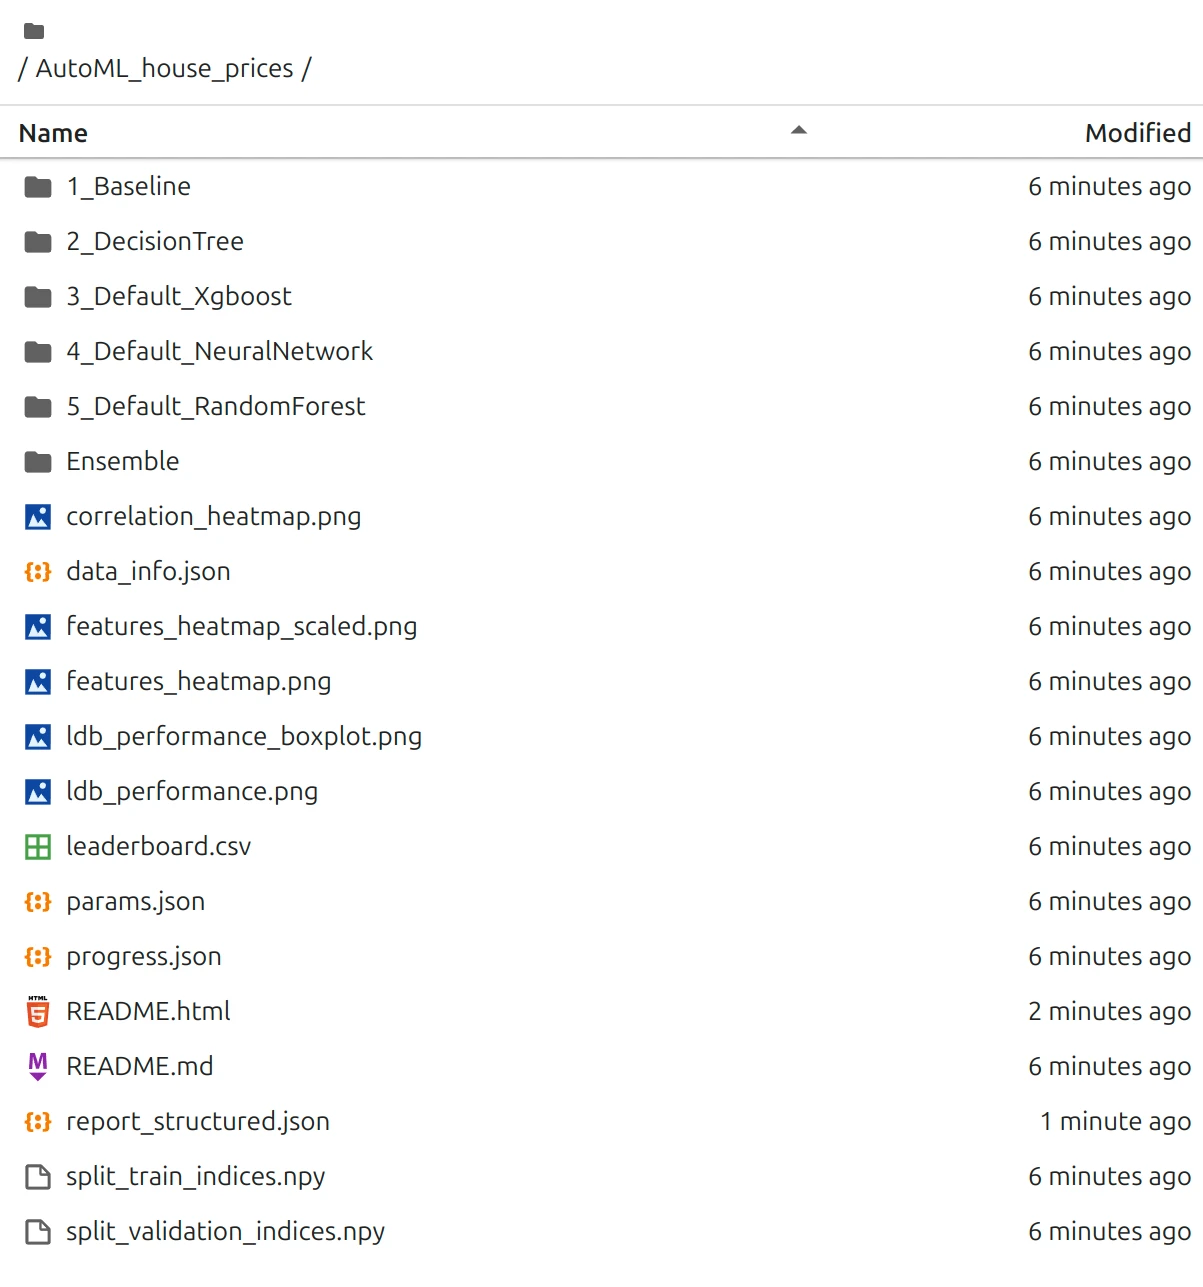
The training results are all stored locally in the directory AutoML_house_prices used in results_path. We can inspect each model documentation.
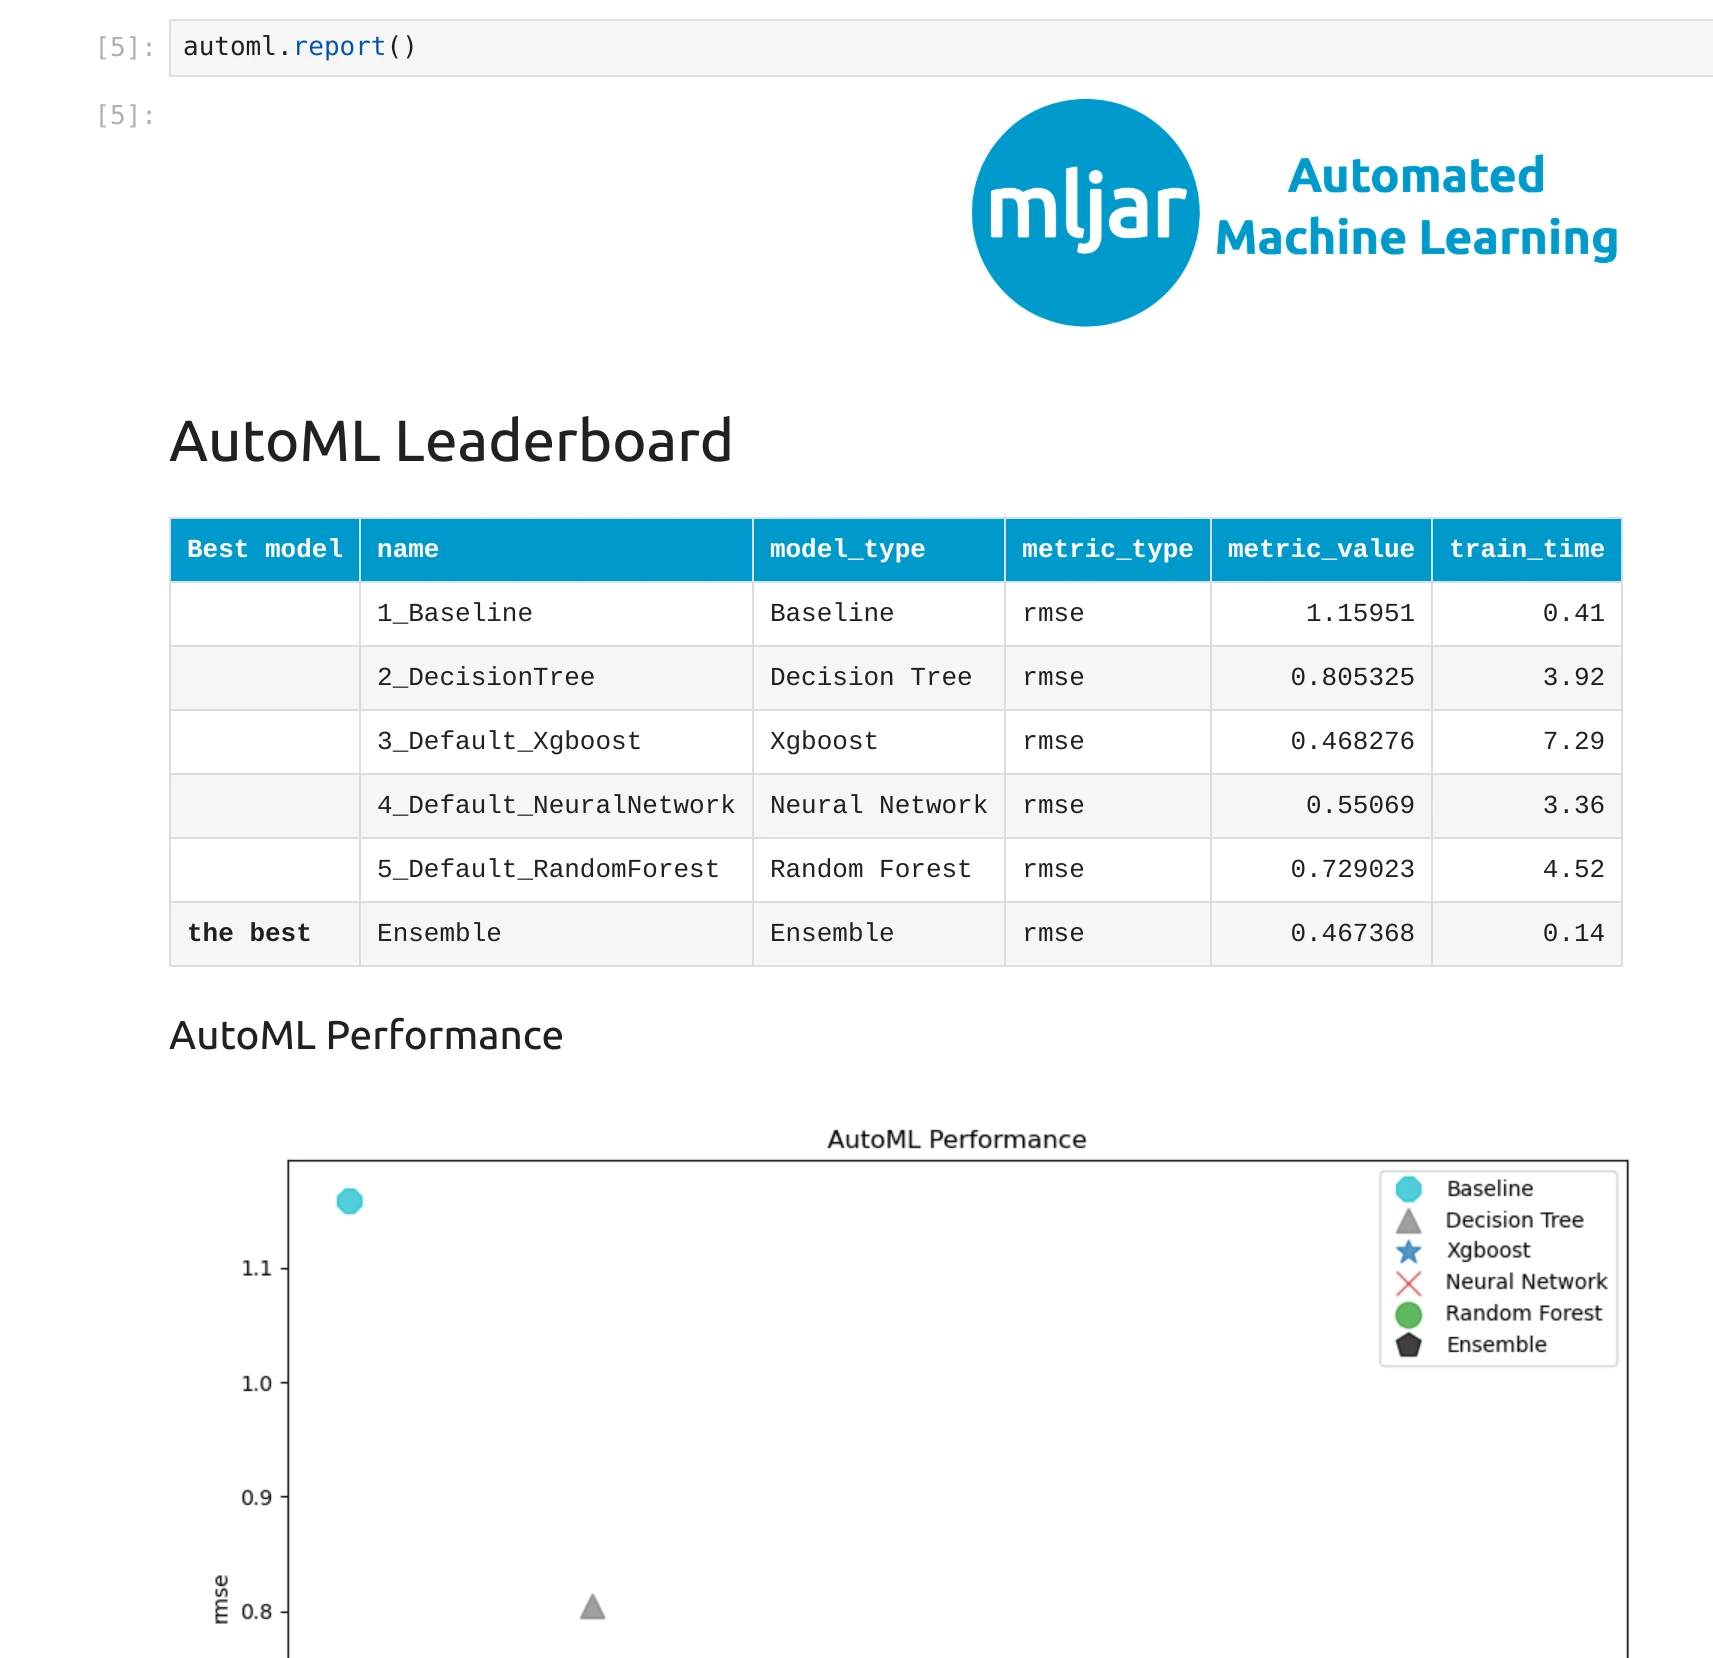
After training, we can generate reports. We can display interactive report with the code.
automl.report()
Please note that we can click in each model in the leaderboard to inspect each model training details and explanations.
There is also a structured version of report ideal for AI agents:
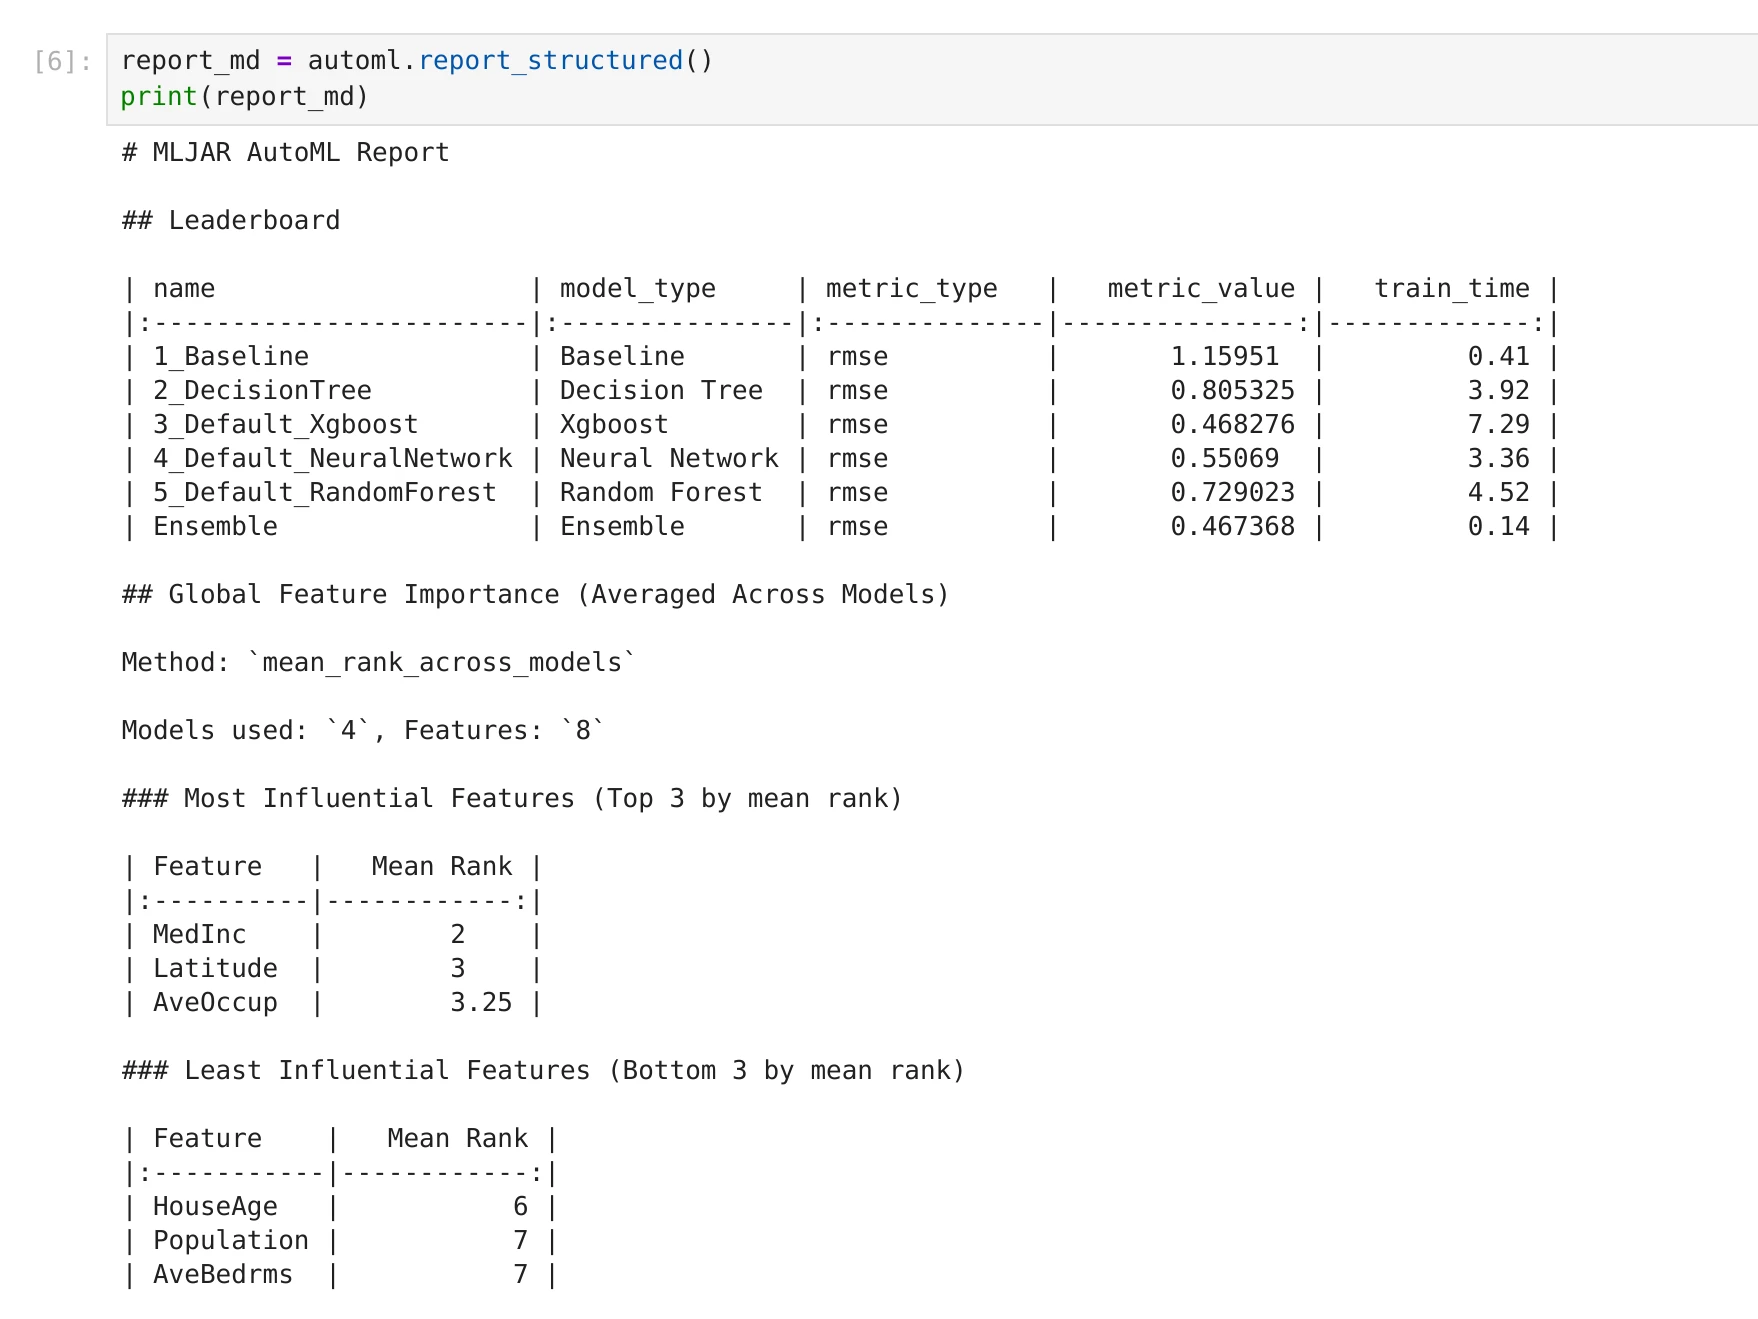
report_md = automl.report_structured()
print(report_md)
Example output of structured AutoML report:
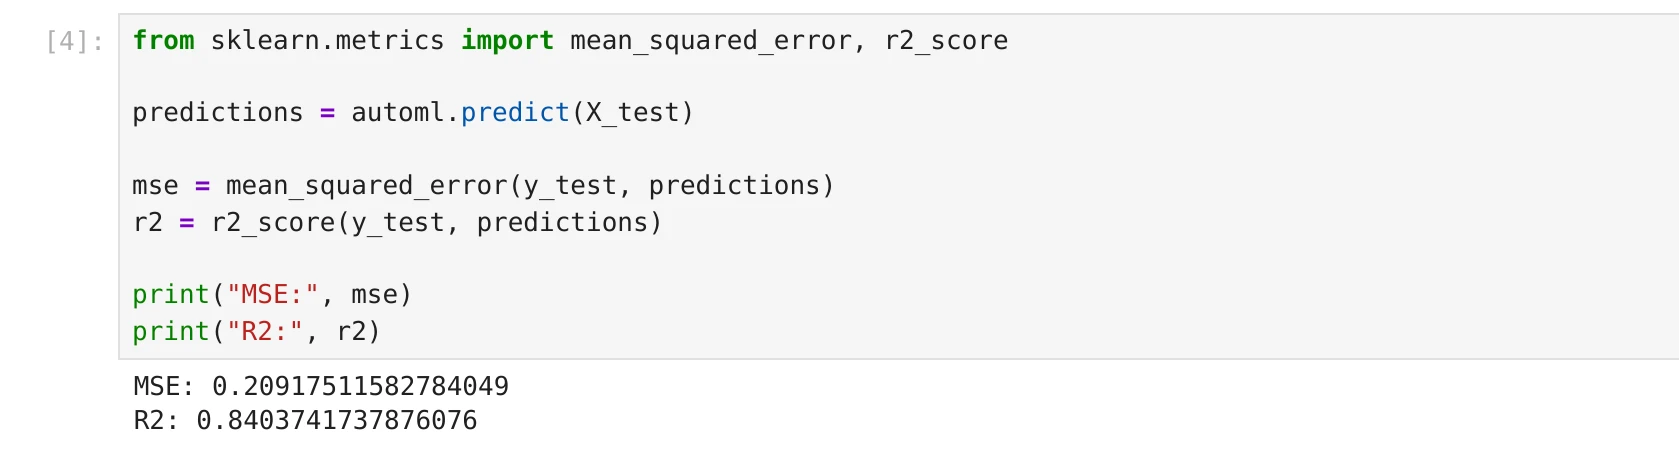
Now let's use the trained model to make predictions.
from sklearn.metrics import mean_squared_error, r2_score

predictions = automl.predict(X_test)

mse = mean_squared_error(y_test, predictions)
r2 = r2_score(y_test, predictions)

print("MSE:", mse)
print("R2:", r2)
The model is now ready.
We trained it on known data, and we checked how well it predicts prices on new data.
Below you can see what this workflow looks like in practice: training progress, results directory, report view, structured report output, and test score summary.
How to evaluate AutoML regression results (MSE, R², RMSE)
Now let’s look at the results and understand what they mean.
First, we check the metrics.
We got:
MSE: 0.209
R²: 0.84
R² is often easier to understand. It tells us how well the model explains the data. An R² of 0.84 means that the model explains about 84% of the variation in house prices.
This is a good result, especially for a simple first model. It means the model has learned useful patterns from the data.
Now let’s look at the leaderboard. AutoML tried several models. At the beginning, we see a simple baseline model. Its RMSE is about 1.16. This is a weak model and gives us a reference point. Then we have better models like Decision Tree, Random Forest, Neural Network, and XGBoost.
The best result comes from the Ensemble model with RMSE around 0.467. This is much better than the baseline, which means AutoML successfully improved the model. It is also important to notice that the error on the test set (MSE) is consistent with the RMSE values seen during training on validation data. This is a good sign. It means the model generalizes well and is not overfitting.
Now let’s look at feature importance. The most important feature is MedInc (median income). This makes sense. Areas with higher income usually have higher house prices. Next important features are Latitude and AveOccup. This tells us that location and how people live in the area also affect the price.
The least important features are: HouseAge, Population, and AveBedrms. This does not mean they are useless, but they have less influence compared to other features.
So, is this a good model? Yes, this is a good model for a beginner example.
It:
- performs much better than the baseline,
- explains most of the variation in prices,
- gives reasonable and interpretable feature importance.
Of course, it is not perfect.
There is still some error, and we could try to improve it with more data or more tuning. But for a first AutoML run, this is a very strong result.
FAQ: AutoML in Python for beginners
What is AutoML in Python?
AutoML in Python is an approach where software automates core machine learning steps like preprocessing, model training, tuning, and comparison.
Is AutoML good for beginners?
Yes. AutoML is one of the easiest ways to start because you can train strong baseline models quickly and learn from generated reports.
Can I use AutoML for regression tasks?
Yes. In this tutorial, we used AutoML for a regression problem: house price prediction.
Do I need Jupyter to use AutoML?
No. You can run AutoML in a Python script or a Jupyter notebook. You can also use MLJAR Studio for a notebook-based workflow with AI Data Analyst.
How do I make AutoML results LLM-friendly?
Use structured reporting and text-first summaries. A good next read is How to Generate LLM-Friendly AutoML Reports in Python.
Conclusion
In this tutorial, you learned how to go from raw data to a working machine learning model using AutoML in Python. We started from the very beginning, first explaining what machine learning is in simple terms, and then showing how AutoML helps automate many of the difficult and time-consuming steps. This makes it much easier to get started, especially if you are new to machine learning.
We then focused on one real problem, predicting house prices. You saw how to load the dataset, explore it, and understand it using the idea of data cards. This way of thinking makes tabular data easier to understand, because each row becomes a simple description of one example with a price tag to predict. From there, we moved step by step into training a model using AutoML.
You also learned how to split the data into training and testing parts, how to train the model with just a few lines of code, and how to evaluate its performance. We looked at metrics like MSE and R², and we analyzed the AutoML report to understand which models performed best and which features were most important. This is a very important step, because machine learning is not only about getting a number, but also about understanding what the model has learned.
Another important takeaway is that you can use AutoML in different ways depending on your workflow. You can run it in a simple Python script when you want something clean and repeatable. You can use a Jupyter Notebook when you want to learn, experiment, and inspect results step by step. You can also use MLJAR Studio if you prefer a more interactive environment, where you can combine notebooks with additional features like conversational workflows.
The most important idea from this tutorial is that starting with machine learning does not have to be complicated. You do not need to know all algorithms or write a lot of code. With tools like MLJAR AutoML, you can focus on understanding your data and your problem, while the system helps you with the technical parts.
Now it is a good moment to try it yourself. Take your own dataset, run AutoML, and see what results you get. Start simple, look at the reports, and build your understanding step by step.
For next steps, explore more Python and machine learning tutorials, run autonomous iterations in AutoLab Experiments, or learn more about MLJAR AutoML.