Create Presentation from Jupyter Notebook
Presentation is a great way to share your results and findings with a nontechnical audience. The data-rich presentation with charts, tables, and code may be tedious to create. You need to copy-paste each image into traditional presentation software manually. What if you need to update all charts because your supervisor or manager asked for them? Ugh... again, a lot of work ... Don't worry, there is a solution for your pain! You can create a presentation directly from Jupyter Notebook. The presentation slides can be constructed from single, multi-code or Markdown cells. The cell's code can be hidden in the presentation (to not scare nontechnical viewers). The final slides can be shared as a website or converted to a PDF file. Some frameworks allow you to parameterize the presentation with widgets making it interactive.
You don't need to install any additional framework to make a presentation from Jupyter Notebook. Jupyter is using Reveal.js library for creating slides. However, I strongly recommend to install RISE (Reveal.js IPython Slideshow Extension) extension. It greatly simplifies the process of slide creation with a live preview.
The outline for this article:
- create a simple notebook with one chart,
- convert notebook to a slideshow,
- presentation development with RISE extension,
- parameterized presentations,
- publishing presentation.
Create Jupyter Notebook
Let's create a Jupyter notebook. It will have a few Markdown and Python cells.
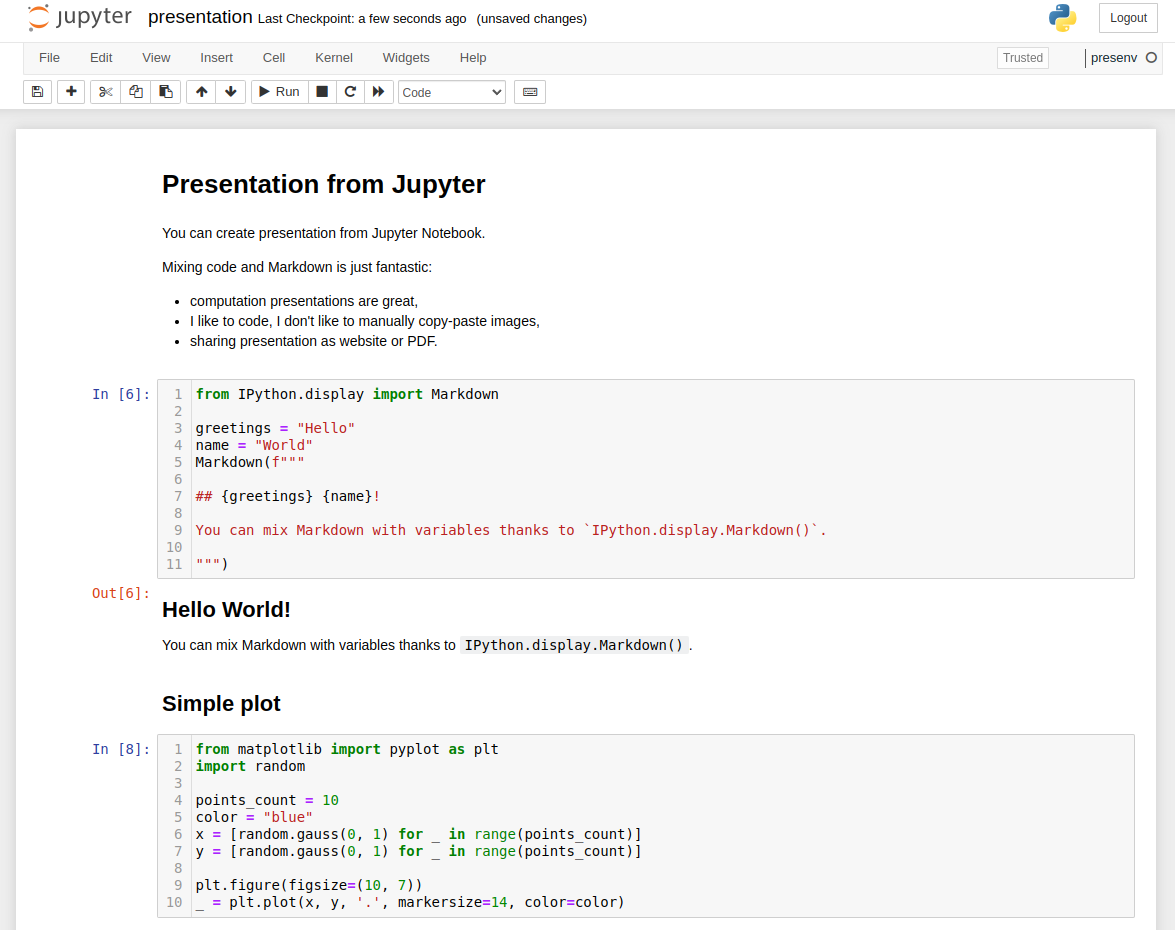
Please notice that we can mix Python variables with Markdown thanks to IPython.display.Markdown() function:
from IPython.display import Markdown

greetings = "Hello"
name = "World"

# display Markdown text with greetings and name variables

Markdown(f"""

## {greetings} {name}!

You can mix Markdown with variables thanks to `IPython.display.Markdown()`.

""")
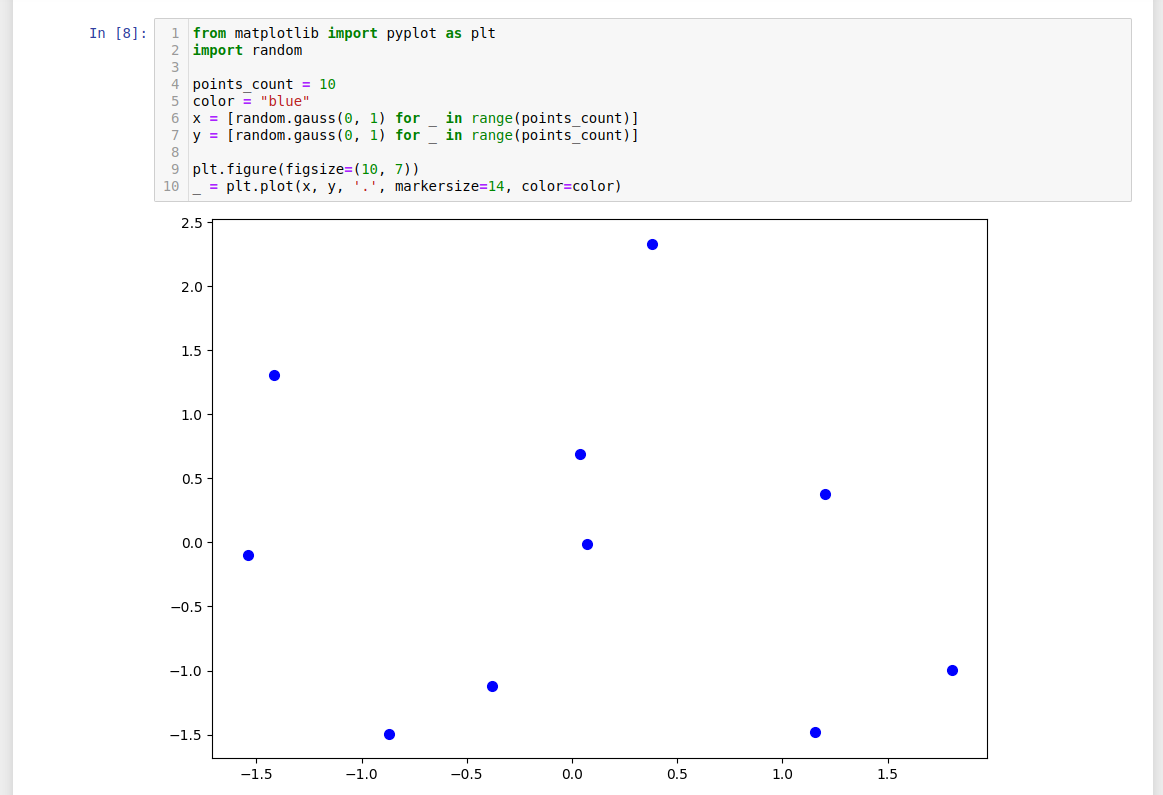
The output of the above code cell will contain a Markdown. There is a simple scatter plot in the notebook for randomly generated points:
from matplotlib import pyplot as plt
import random

points_count = 10
color = "blue"
x = [random.gauss(0, 1) for _ in range(points_count)]
y = [random.gauss(0, 1) for _ in range(points_count)]

plt.figure(figsize=(10, 7))
_ = plt.plot(x, y, '.', markersize=14, color=color)
The matplotlib scatter plot:
It is a simple notebook created for example purposes. There is no limit on the number of slides or cells. From my experience, I was creating a presentation with more than 70 slides with many plots/images, and the slideshow was working smoothly, even with the presentation published as a website (hosted in the cloud).

Create Presentation
The notebook is saved in ipynb format. The next step is to convert it to a slideshow. We need to provide information on how to use cells in the presentation. Please click View➡️Cell Toolbar➡️Slideshow.
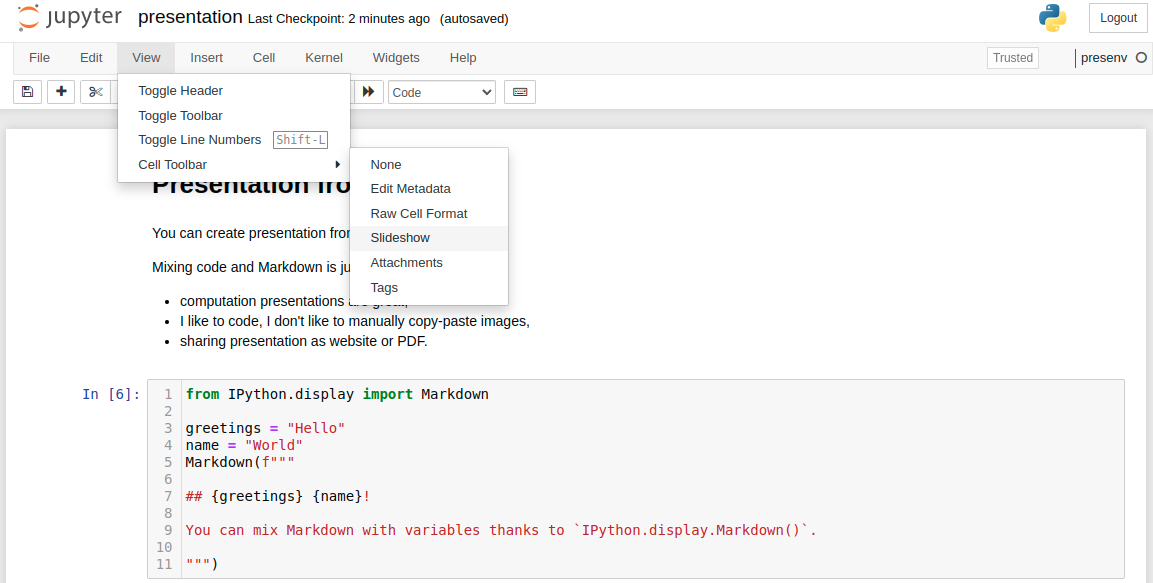
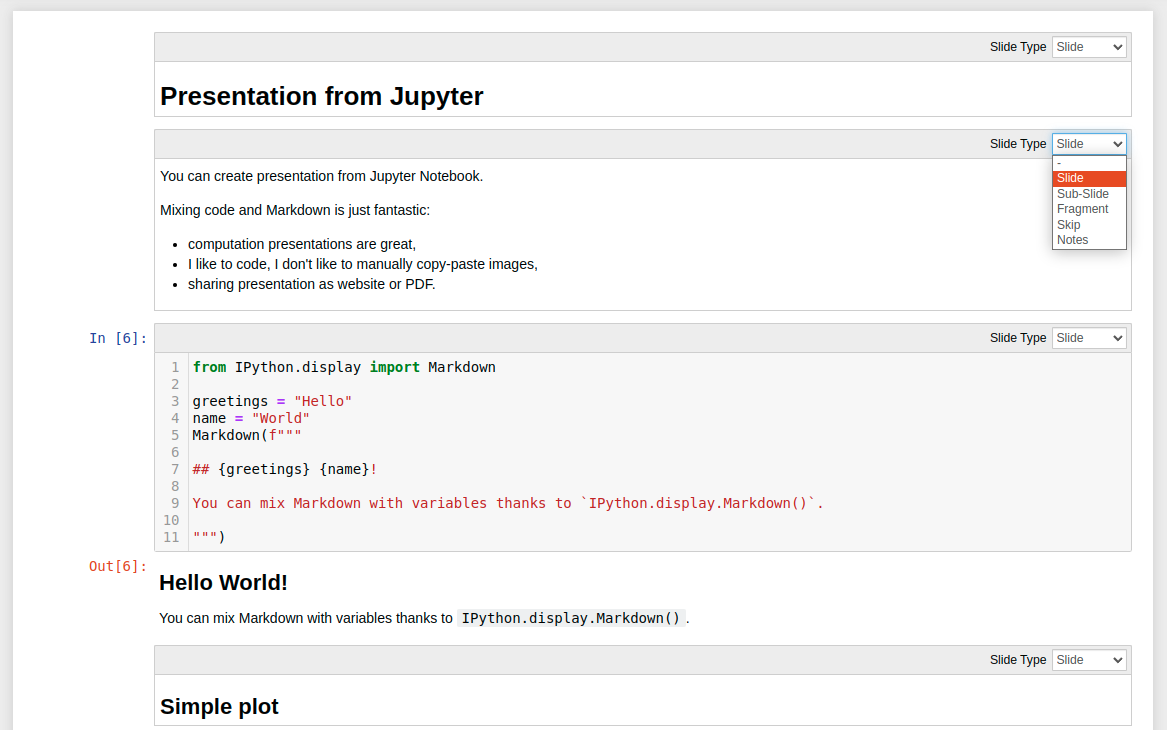
Each cell will have a toolbar with the select widget. You can select there how cells will be used in the presentation:
Slide- the cell will be a new slide;Sub-Slide- the cell will be shown in the current slide as a replacement for previous content. It will be available in arrow-down navigation;Fragment- the cell will appear in the current slide, it will append to the previous content. It will be available in arrow-down and arrow-right navigation;Skip- the content will not be displayed in the presentation;Notes- notes for slide, the cell content is not displayed in the presentation;
Please select the Slide Type for every cell and save the notebook.
How to create a presentation for Jupyter Notebook? We need to use the nbconvert tool. It is installed with Jupyter Notebook. There is a command for converting notebook to presentation:
# command to convert notebook to presentation
jupyter nbconvert --to slides presentation.ipynb

# example output
>> [NbConvertApp] Converting notebook presentation.ipynb to slides
>> [NbConvertApp] Writing 597949 bytes to presentation.slides.html
You can open the output file presentation.slides.html in the web browser (just double-click on the file). Alternatively, you can serve slides with jupyter; slides will be available at http://127.0.0.1:8000/presentation.slides.html:
jupyter nbconvert --to slides presentation.ipynb --post serve

There are several ways to hide the code in the presentation, one of them is to pass --no-input parameter to nbconvert:
# command to convert notebook to presentation with hidden code

jupyter nbconvert --to slides --no-input presentation.ipynb
The presentation with hidden code:

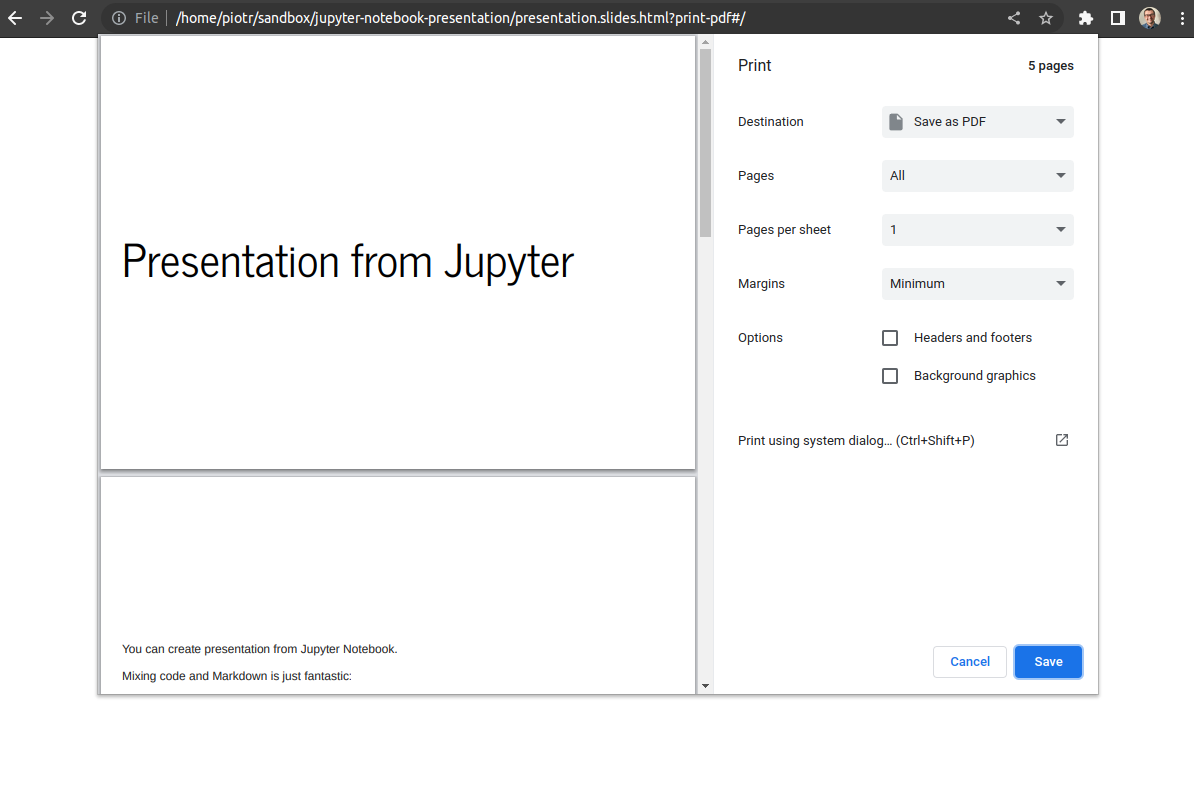
It is possible to convert the Jupyter Notebook presentation into PDF slides. One of the ways to do this is to add ?print-pdf in the URL in a web browser while displaying HTML format:
file:///home/piotr/sandbox/jupyter-notebook-presentation/presentation.slides.html?print-pdf#/
The presentation will be in a format ready to print. To save it as a PDF, just print the website with Save as PDF selected for the destination.
RISE Extension
There is a RISE extension that may be helpful for developing presentations in Jupyter Notebook. It can be easily installed with pip or conda:
# with pip
pip install rise

# or install with conda
conda install -c conda-forge rise
You get a small chart icon in the top toolbar after installation. You switch between the notebook and presentation views by clicking on the chart icon.

What is more, you can edit the code in presentation mode. The RISE extension doesn't have the option to hide the code (GitHub issue discussion about hiding code feature in RISE repository). If you would like to hide/show the code during the presentation development, you need to install an additional extension called hide_code.
Parameterized Presentation
What if you would like to change or recompute charts in the presentation based on user input? There is an open-source framework called Mercury that makes it possible.
You can easily add interactive widgets to the presentation and publish it with Mercury. Widgets are added based on the YAML header. They are directly connected with Python variables in the notebook. User changes, tweak widgets, and execute the notebook with new values. The slides in the presentation will be automatically recomputed.
The video from an interactive presentation about Mercury:
Publishing Presentation
The final presentation is in HTML format. You can publish it as a static website. There are several ways to publish Jupyter Notebook; you can host it on GitHub Pages, Netlify, or Vercel. If you are using Mercury framework for parameterized presentations, you can host it in the cloud (soon, there will be available online service runmercury.com for hosting notebooks).
Summary
Jupyter Notebook Presentations might be a great alternative to traditional presentation software. You will save time by building the presentation in the same environment where your code is. Any update in code or chart change will immediately affect the presentation - no need to manually copy-paste results. The parameterized presentation can take your slides one step further. Imagine your supervisor or manager playing with your slides and recomputing new charts.
AI Data Analyst on Your Computer
Use MLJAR Studio to explore data, find insights, and create reports with AI. Everything runs locally, so your data stays with you.
About the Authors


Related Articles
- Dashboard for Data Drift Detection in Python
- Automated PDF Reports with Python
- The 3 ways to export Jupyter Notebook to HTML
- The 5 ways to schedule Jupyter Notebook
- Schedule Jupyter Notebook to run daily
- Create Parameterized Presentation in Jupyter Notebook
- The 3 ways to hide code in Jupyter Notebook Presentation
- Convert Jupyter Notebook to spaCy NLP web application
- The 4 ways to run Jupyter Notebook in command line
- The 2 ways to convert Jupyter Notebook Presentation to PDF slides