Dashboard for Data Drift Detection in Python
Change is the only constant in life - Heraclitus quote is so relevant in the Machine Learning world. The ML models that are running in the production need to be monitored. Why? Because data can change in time, leading to wrong predictions. The change in data distribution is so-called a data drift. I will show you how to build a dashboard for data drift detection in Python. I will use Evidently Python package for detecting data drift and building a dashboard in the Jupyter Notebook. The dashboard notebook will be published as a web application with the Mercury framework.
The web application is deployed in the Heroku cloud and accessible at data-drift-detection.herokuapp.com. The code for this article is on GitHub pplonski/data-drift-detection. The demo of the website is below:

What is data drift?
Data drift is a name for data change that can affect the Machine Learning model performance. There are different types of the drift. There can be change in target distribution. For example, you have a model that predicts house price based on the property description (number of rooms, location, etc.) but there is a change in the market and all properties prices go up. If you don't detect the drift in the target distribution and don't update the model with new targets then your model will predict too low pricies. The change in the target disribution is so-called target drift. The next type of drift is covariate drift. It is a change in the input data distribution. For example, you have a categorical feature that will start to have new category.
What to do after data drift detection?
When data drift is detected the ML model should be updated. There are many ways in which it can be done - all depends on the data. The most strightforward way is to use all available data samples to train a new model. The other approach might be to use just a new data samples to train the model. There might be also approaches with samples weighting - giving higher weight for fresh data samples and lower weights for old samples. It all depends on the data.
How to detect data drift?
The data drift can be detected in different ways. The simplest approach is to use statistical tests that compare the distribution of the training data (referred as baseline or reference) and live data (production data). If the difference between two distributions is significant then a drift occured. The most popular tests are two-sample Kolmogorov-Smirnov test, Chi-square test, Jensen–Shannon divergence, Wasserstein distance. The alternative approach might be to use Machine Learning model to monitor the data quality. There can be also a hybrid approaches.
Personally, I'd start with a simple statistical test and will try to understand the data behavior. If you are reading this article you are on a good way to building a robust ML system.
Data Drift Detection in Python
Let's start by setting up a code repository for the project. I'm using GitHub. My repository address is: pplonski/data-drift-detection. Please create a new repo and clone it to the local file system:
git clone git@github.com:pplonski/data-drift-detection.git
I'm using virtual environment for each project and keep needed packages in the requirements.txt file:
virtualenv evi
source evi/bin/activate
pip install evidently mljar-mercury
The file requirements.txt should have:
evidently
mljar-mercury
The evidently is a package for data drift detection and monitoring. The mljar-mercury is a package for converting Jupyter Notebook to web application so it can be shared with non-technical users. In the evidently docs there is recommendation to enable its extension, however I didn't run those commands and it was working fine (just need to add mode="inline" when displaying dashboards).
Let's add the evi environment to the Jupyter kernels list:
python -m ipykernel install --user --name evi
We are ready to create a new notebook. Please remember to select evi kernel when creating a new notebook. Let's import needed packages:
import pandas as pd
from sklearn import datasets
from evidently.dashboard import Dashboard
from evidently.dashboard.tabs import DataDriftTab, CatTargetDriftTab
Let's use a toy dataset from sklearn package. It will be Iris dataset. It represents a classification problem.
iris = datasets.load_iris()
iris_frame = pd.DataFrame(iris.data, columns = iris.feature_names)
iris_frame['target'] = iris.target
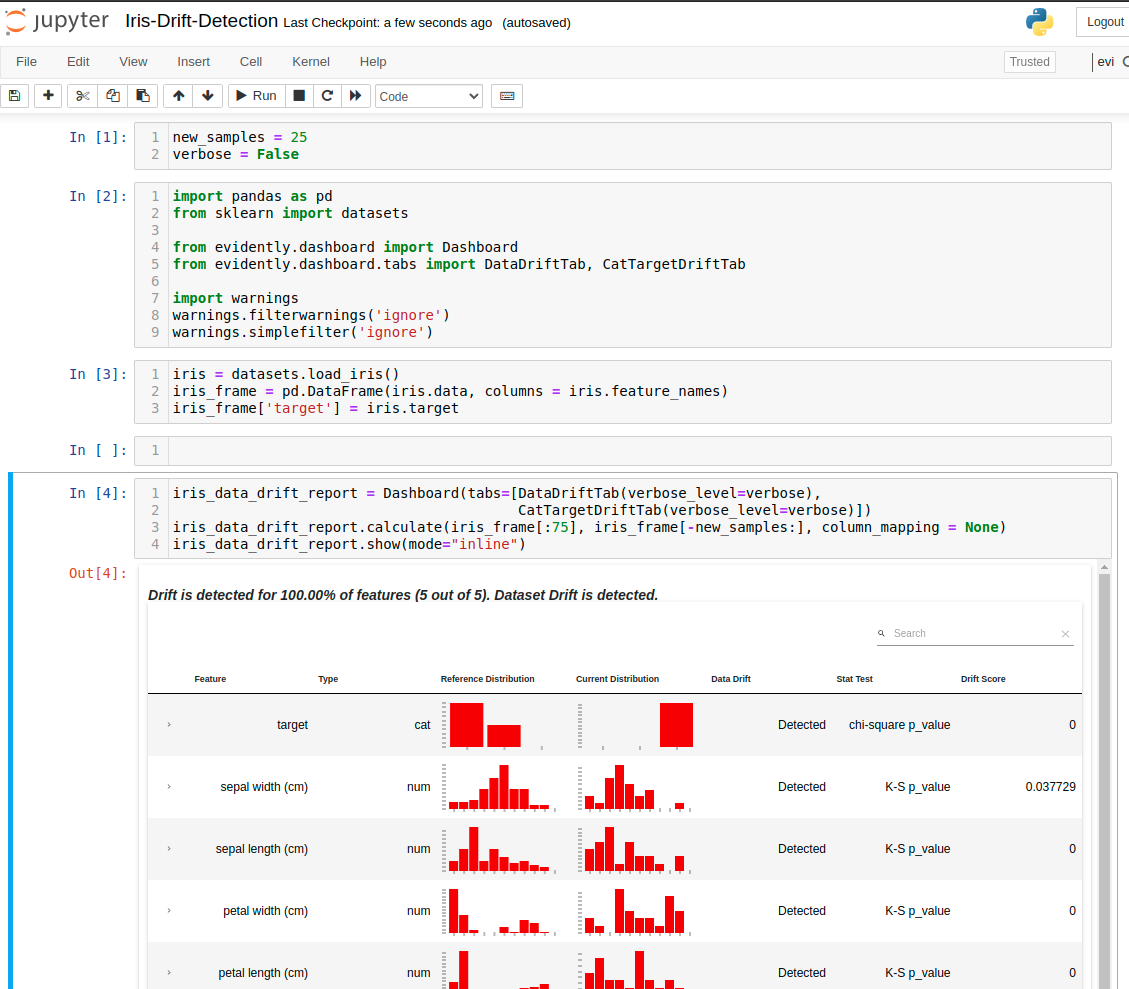
We will use 75 first samples as a reference data (data used for training). There will be new_sampels variable that will control the number of new samples considered for drift detection. The drift detection and dashboard can be constructed with 3 lines of Python code:
iris_data_drift_report = Dashboard(tabs=[DataDriftTab(verbose_level=verbose),
                                         CatTargetDriftTab(verbose_level=verbose)])
iris_data_drift_report.calculate(iris_frame[:75], iris_frame[-new_samples:], column_mapping = None)
iris_data_drift_report.show(mode="inline")
The verbose variable is boolean that controls the verbosity level of displayed dahsboard. I've set it to False. The notebook with code is presented below:
It is working locally, but how to share the notebook with other stakeholders? Let's make an interactive web application from it and share with other users. We will use an open-source Mercury framework.
Convert notebook to web app
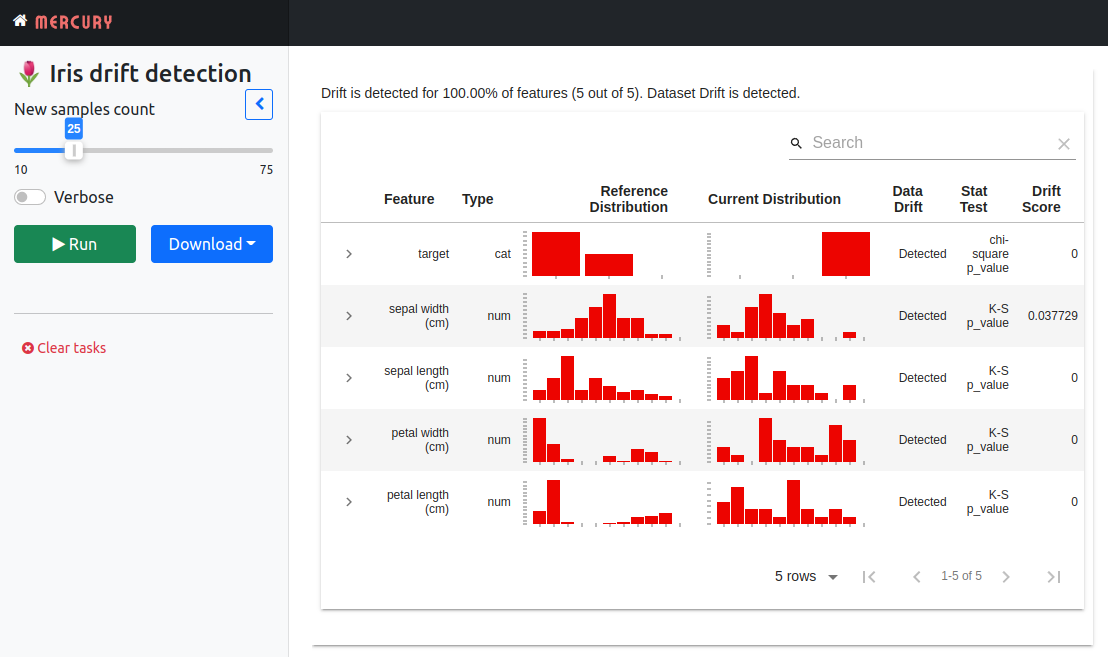
The Mercury framework is controlled with the YAML header. Just add the YAML configuration in the first cell. Please set a cell as a RAW type. The YAML header is below:
---
title: 🌷 Iris drift detection
description: Data and target drift detection in classification task
show-code: False
params:
    new_samples:
        input: slider
        value: 25
        label: New samples count
        min: 10
        max: 75
    verbose:
        input: checkbox
        value: False
        label: Verbose
---
It sets the title and description of the app. It hides the code with show-code: False parameter. The two widgets are added:
new_samples- it is a slider widget, with default value set to 25 that controls the number of new samples used for detecting drift,verbose- it is a checkbox that controls verbosity of theEvidentlydashboard.
It is important to note that Mercury widgets are directly conected to the variables in the Python code. The variables that are conected with widgets should be in the separate cell:
new_samples = 25
verbose = False
The end-user will be able to tweak widgets values. The notebook will be executed with new parameters after Run click . That's all! 😊 You can run the web application locally with the following command:
mercury run
Please open the web browset at address http://127.0.0.1:8000. You should see the notebook as the web app. The user can tweak widgets values and click Run to execute the notebook with new parameters.
Deployment
The Mercury framework is built on top of the Django. It can be deployed on any machine with Python available. I will deploy it to Heroku. It offers a free dynos which are perfect for demo purposes. Please check Mercury documentation for other deployment options. I'm using Heroku CLI. The deployment can be done with one command.
Let's create files needed by Heroku. The Procfile:
web: mercury run 0.0.0.0:$PORT
and runtime.txt:
python-3.8.13
The server creation on Heroku can be done with the following command:
heroku create data-drift-detection
It will create a new dyno for us. The next step is to add all files to the repo:
git add Iris-Drift-Detection.ipynb
git add requrements.txt
git add Procfile
git add runtime.txt
The web app is deployed with the following command:
git push heroku main
Please wait a while and the application should be available online. My app is running at data-drift-detection.herokuapp.com.
Scheduling and email notification
You can add scheduling and email notofications with the Mercury framework. You need to add schedule and notify parameters. The schedule accepts crontab string. It defines at what time intervals the notebook will be automatically executed. The example schedule parameter that will execute the notebook at 8:30AM from Monday to Friday is presented below:
schedule: '30 8 * * 1-5'
What is more, executed notebook can be attached as PDF in the email:
notify:
    on_success: person1@mail.com, person2@mail.com, person3@mail.com
    attachment: pdf
The on_success parameter defines the list of emails that will recevie the email notification after successful notebook execution. The attachment defines the notebook format that will be attached to the email. The complete YAML will look like:
---
title: 🌷 Iris drift detection
description: Data and target drift detection in classification task
schedule: '30 8 * * 1-5'
notify:
    on_success: person1@mail.com, person2@mail.com, person3@mail.com
    attachment: pdf
show-code: False
params:
    new_samples:
        input: slider
        value: 25
        label: New samples count
        min: 10
        max: 75
    verbose:
        input: checkbox
        value: False
        label: Verbose
---
The notebook will be executed automatically, exported to PDF and send in email after the deployment. You will get daily PDF report with data drift check. Please check documentation for more details about notebook scheduling.
Summary
The data drift monitoring and detection is important part of Machine Learning pipeline. The tools like Evidently can greatly simplify the process of data drift monitoring. The Mercury framework makes it possible to deploy data drifting monitoring notebooks as web applications. The notebook can be automatically executed and send as the PDF in the email.
- Python code used in the article is available at github.com/pplonski/data-drift-detection
- Web application for data drift monitoring is available online on data-drift-detection.herokuapp.com
If you have any questions or need help please subscribe to the newsletter below. In the form, you can leave feedback, comment, or question. We do our best to respond quickly :)
AI Data Analyst on Your Computer
Use MLJAR Studio to explore data, find insights, and create reports with AI. Everything runs locally, so your data stays with you.
About the Authors


Related Articles
- The 4 ways to insert images in Jupyter Notebook
- Build dashboard in Python with automatic updates and email notifications
- The 4 ways to install Jupyter Notebook
- How to create a dashboard in Python with Jupyter Notebook?
- How to send email in Python? (the simplest approach)
- Automated PDF Reports with Python
- The 3 ways to export Jupyter Notebook to HTML
- The 5 ways to schedule Jupyter Notebook
- Schedule Jupyter Notebook to run daily
- Create Presentation from Jupyter Notebook