Visualize a Decision Tree in 5 Ways with Scikit-Learn and Python
 A Decision Tree is a supervised algorithm used in machine learning. It is using a binary tree graph (each node has two children) to assign for each data sample a target value. The target values are presented in the tree leaves. To reach to the leaf, the sample is propagated through nodes, starting at the root node. In each node a decision is made, to which descendant node it should go. A decision is made based on the selected sample’s feature. Decision Tree learning is a process of finding the optimal rules in each internal tree node according to the selected metric.
The decision trees can be divided, with respect to the target values, into:
- Classification trees used to classify samples, assign to a limited set of values - classes. In scikit-learn it is
DecisionTreeClassifier. - Regression trees used to assign samples into numerical values within the range. In scikit-learn it is
DecisionTreeRegressor.
Decision trees are a popular tool in decision analysis. They can support decisions thanks to the visual representation of each decision.
Below I show 5 ways to visualize Decision Tree in Python:
- print text representation of the tree with
sklearn.tree.export_textmethod - plot with
sklearn.tree.plot_treemethod (matplotlib needed) - plot with
sklearn.tree.export_graphvizmethod (graphviz needed) - plot with
dtreevizpackage (dtreeviz and graphviz needed) - plot with our own
supertreepackage
I will show how to visualize trees on classification and regression tasks.
Train Decision Tree on Classification Task
I will train a DecisionTreeClassifier on iris dataset. I will use default hyper-parameters for the classifier.
from matplotlib import pyplot as plt
from sklearn import datasets
from sklearn.tree import DecisionTreeClassifier
from sklearn import tree
# Prepare the data data
iris = datasets.load_iris()
X = iris.data
y = iris.target
# Fit the classifier with default hyper-parameters
clf = DecisionTreeClassifier(random_state=1234)
model = clf.fit(X, y)
Print Text Representation
Exporting Decision Tree to the text representation can be useful when working on applications whitout user interface or when we want to log information about the model into the text file. You can check details about export_text in the sklearn docs.
text_representation = tree.export_text(clf)
print(text_representation)
|--- feature_2 <= 2.45
|   |--- class: 0
|--- feature_2 >  2.45
|   |--- feature_3 <= 1.75
|   |   |--- feature_2 <= 4.95
|   |   |   |--- feature_3 <= 1.65
|   |   |   |   |--- class: 1
|   |   |   |--- feature_3 >  1.65
|   |   |   |   |--- class: 2
|   |   |--- feature_2 >  4.95
|   |   |   |--- feature_3 <= 1.55
|   |   |   |   |--- class: 2
|   |   |   |--- feature_3 >  1.55
|   |   |   |   |--- feature_0 <= 6.95
|   |   |   |   |   |--- class: 1
|   |   |   |   |--- feature_0 >  6.95
|   |   |   |   |   |--- class: 2
|   |--- feature_3 >  1.75
|   |   |--- feature_2 <= 4.85
|   |   |   |--- feature_1 <= 3.10
|   |   |   |   |--- class: 2
|   |   |   |--- feature_1 >  3.10
|   |   |   |   |--- class: 1
|   |   |--- feature_2 >  4.85
|   |   |   |--- class: 2
If you want to save it to the file, it can be done with following code:
with open("decistion_tree.log", "w") as fout:
    fout.write(text_representation)
Plot Tree with plot_tree
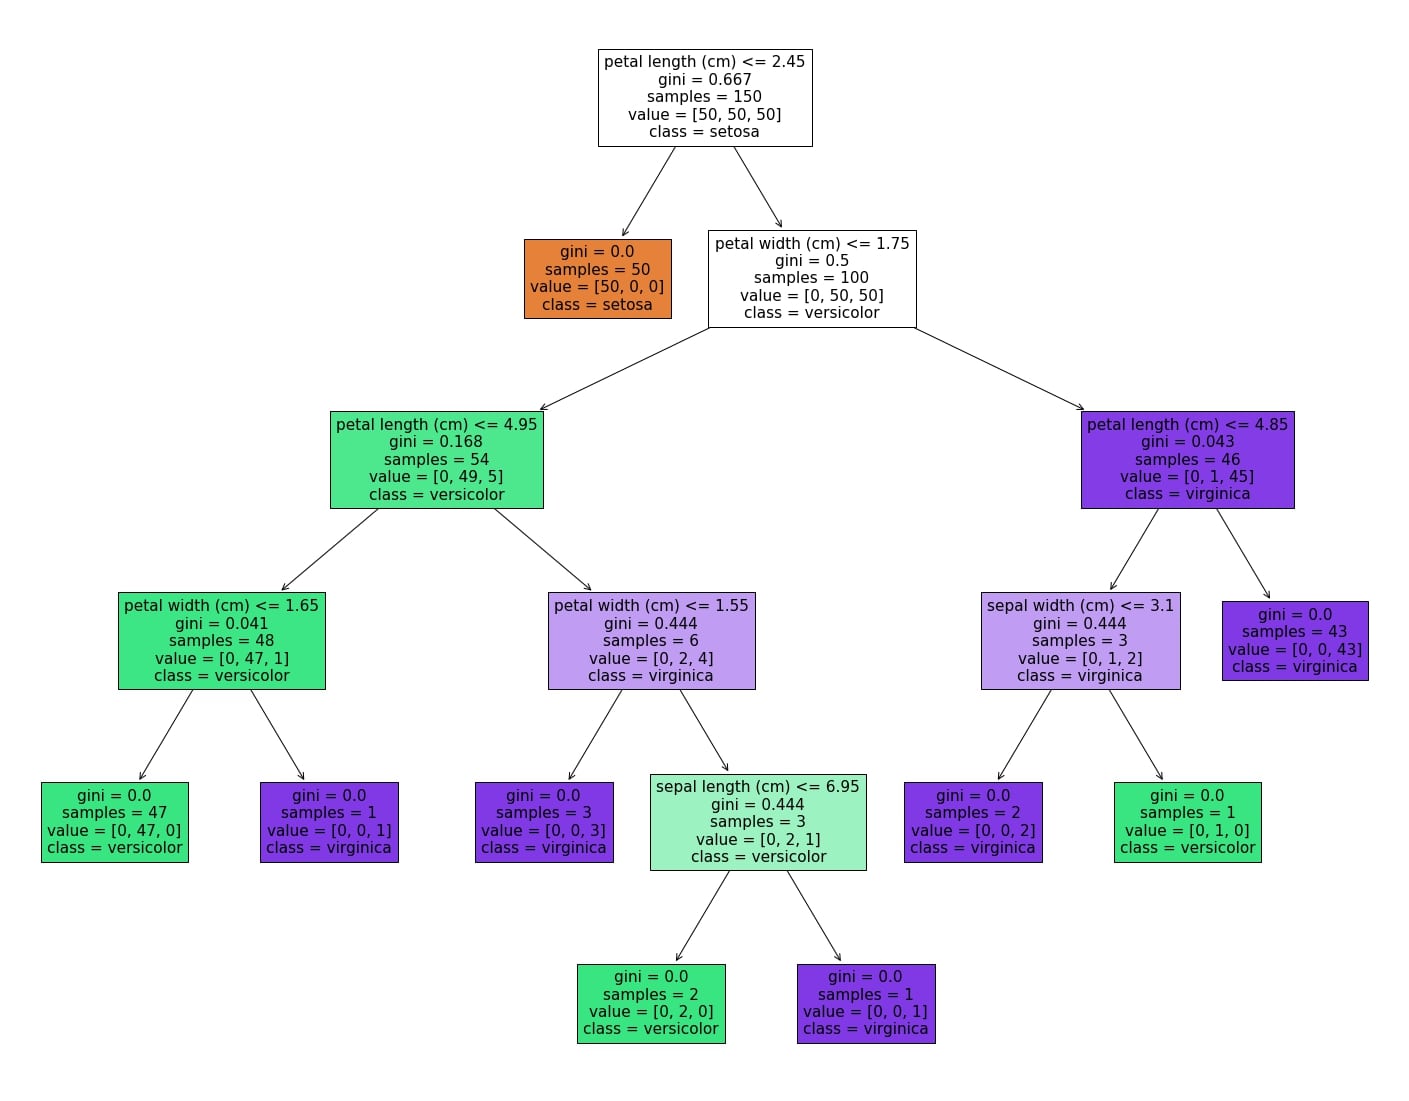
The plot_tree method was added to sklearn in version 0.21. It requires matplotlib to be installed. It allows us to easily produce figure of the tree (without intermediate exporting to graphviz) The more information about plot_tree arguments are in the docs.
fig = plt.figure(figsize=(25,20))
_ = tree.plot_tree(clf,
                   feature_names=iris.feature_names,
                   class_names=iris.target_names,
                   filled=True)
(The plot_tree returns annotations for the plot, to not show them in the notebook I assigned returned value to _.)
To save the figure to the .png file:
fig.savefig("decistion_tree.png")
Please notice that I'm using filled=True in the plot_tree. When this parameter is set to True the method uses color to indicate the majority of the class. (It will be nice if there will be some legend with class and color matching.)
Visualize Decision Tree with graphviz
Please make sure that you have graphviz installed (pip install graphviz). To plot the tree first we need to export it to DOT format with export_graphviz method (link to docs).
Then we can plot it in the notebook or save to the file.
import graphviz
# DOT data
dot_data = tree.export_graphviz(clf, out_file=None,
                                feature_names=iris.feature_names,
                                class_names=iris.target_names,
                                filled=True)

# Draw graph
graph = graphviz.Source(dot_data, format="png")
graph

graph.render("decision_tree_graphivz")
'decision_tree_graphivz.png'
Plot Decision Tree with dtreeviz Package
The dtreeviz package is available in github. It can be installed with pip install dtreeviz. It requires graphviz to be installed (but you dont need to manually convert between DOT files and images). To plot the tree just run:
from dtreeviz.trees import dtreeviz # remember to load the package

viz = dtreeviz(clf, X, y,
                target_name="target",
                feature_names=iris.feature_names,
                class_names=list(iris.target_names))

viz

Save visualization to the file:
viz.save("decision_tree.svg")
Plot Decision Tree with supertree Package
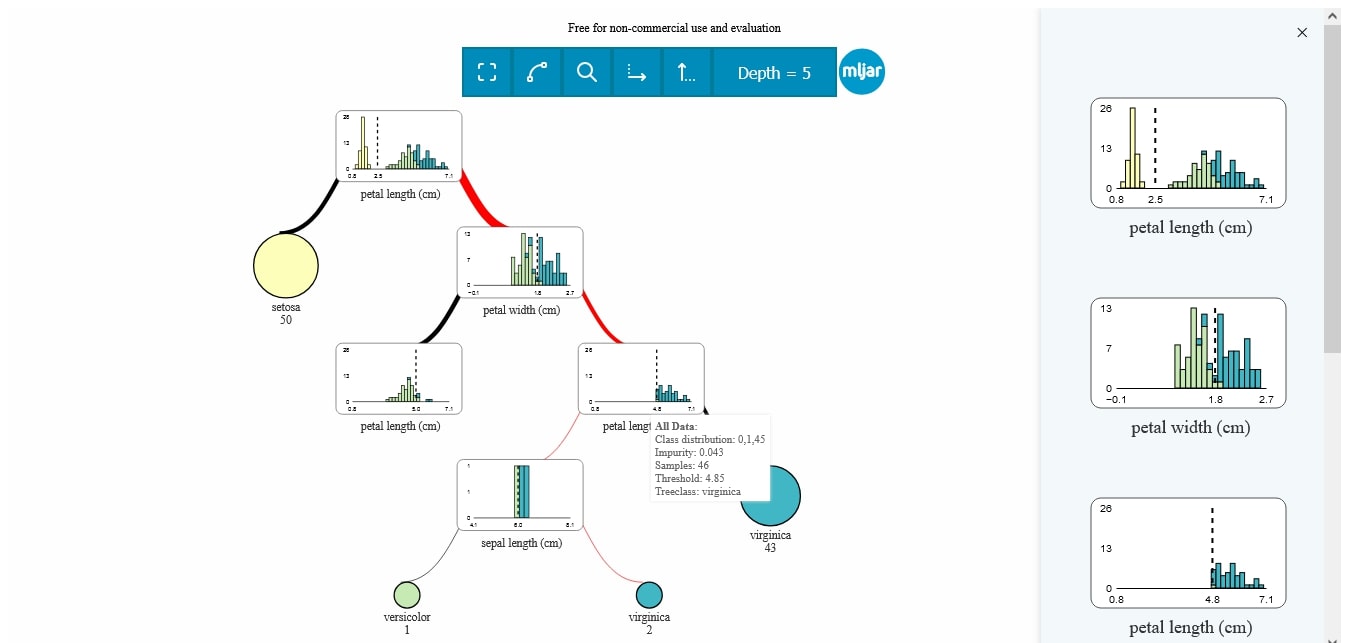
The SuperTree Package is available on GitHub or can be installed with pip install supertree. SuperTree supports many algorithms and is integrated with MLJAR Studio. We recommend using Jupyter Notebook as some IDEs don't support the current plot displaying method.
from sklearn.tree import DecisionTreeClassifier
from sklearn.datasets import load_iris
from supertree import SuperTree # <- import supertree :)

# Load the iris dataset
iris = load_iris()
X, y = iris.data, iris.target

# Train model
model = DecisionTreeClassifier()
model.fit(X, y)

# Initialize supertree
super_tree = SuperTree(model, X, y, iris.feature_names, iris.target_names)

# show tree in your notebook
super_tree.show_tree()
SuperTree allows you to:
- drag, zoom in and reset plot,
- open and collapse nodes,
- read node info by hovering mouse over element,
- display track from the leaf,
- enable visualisation of amount of samples between nodes.
In last line you may also use super_tree.save_html() to generate HTML file, and then open it in any web browser.
Visualizing the Decision Tree in Regression Task
Below, I present all 5 methods for DecisionTreeRegressor from scikit-learn package (in python of course).
from sklearn import datasets
from sklearn.tree import DecisionTreeRegressor
from sklearn import tree
# Prepare the data data
boston = datasets.load_boston()
X = boston.data
y = boston.target
To keep the size of the tree small, I set max_depth = 3.
# Fit the regressor, set max_depth = 3
regr = DecisionTreeRegressor(max_depth=3, random_state=1234)
model = regr.fit(X, y)
text_representation = tree.export_text(regr)
print(text_representation)
|--- feature_5 <= 6.94
|   |--- feature_12 <= 14.40
|   |   |--- feature_7 <= 1.38
|   |   |   |--- value: [45.58]
|   |   |--- feature_7 >  1.38
|   |   |   |--- value: [22.91]
|   |--- feature_12 >  14.40
|   |   |--- feature_0 <= 6.99
|   |   |   |--- value: [17.14]
|   |   |--- feature_0 >  6.99
|   |   |   |--- value: [11.98]
|--- feature_5 >  6.94
|   |--- feature_5 <= 7.44
|   |   |--- feature_4 <= 0.66
|   |   |   |--- value: [33.35]
|   |   |--- feature_4 >  0.66
|   |   |   |--- value: [14.40]
|   |--- feature_5 >  7.44
|   |   |--- feature_10 <= 19.65
|   |   |   |--- value: [45.90]
|   |   |--- feature_10 >  19.65
|   |   |   |--- value: [21.90]
fig = plt.figure(figsize=(25,20))
_ = tree.plot_tree(regr, feature_names=boston.feature_names, filled=True)
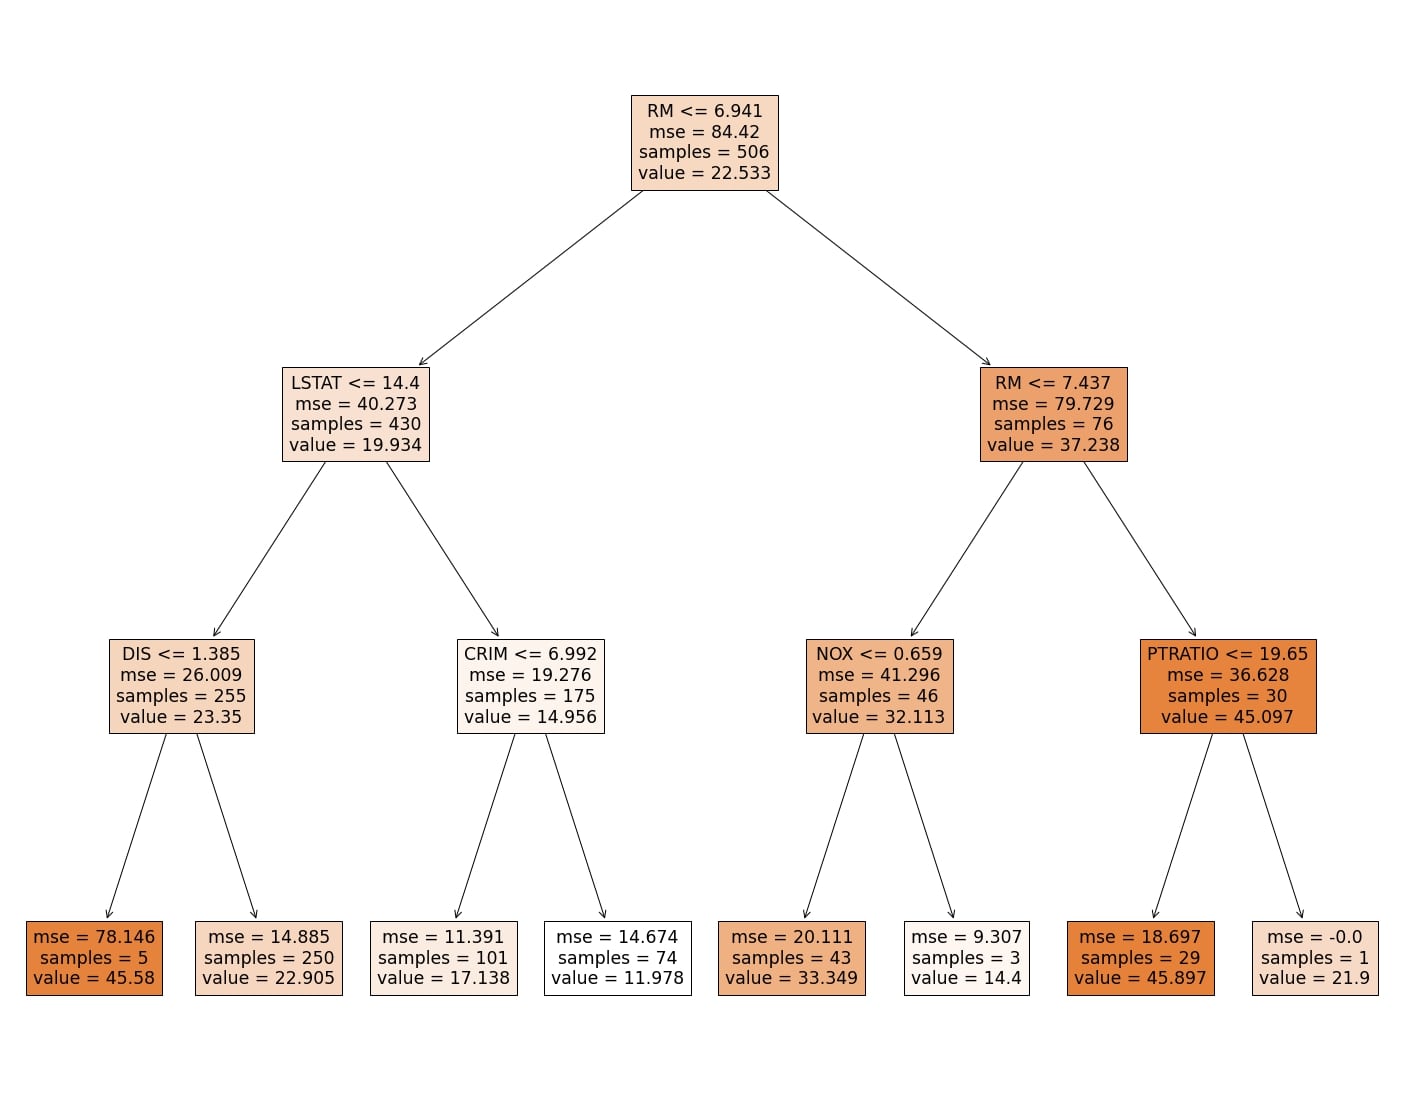
Please notice, that the color of the leaf is coresponding to the predicted value.
dot_data = tree.export_graphviz(regr, out_file=None,
                                feature_names=boston.feature_names,
                                filled=True)
graphviz.Source(dot_data, format="png")

from dtreeviz.trees import dtreeviz # remember to load the package

viz = dtreeviz(regr, X, y,
                target_name="target",
                feature_names=boston.feature_names)
viz

From above methods my favourite is visualizing with dtreeviz package. I like it becuause:
- it shows the distribution of decision feature in the each node (nice!)
- it shows the class-color matching legend
- it shows the distribution of the class in the leaf in case of classification tasks, and mean of the leaf's reponse in the case of regression tasks
It would be great to have dtreeviz visualization in the interactive mode, so the user can dynamically change the depth of the tree. I'm using dtreeviz package in my Automated Machine Learning (autoML) Python package mljar-supervised. You can check the details of the implementation in the github repository. One important thing is, that in my AutoML package I'm not using decision trees with max_depth greater than 4. I add this limit to not have too large trees, which in my opinion loose the ability of clear understanding what's going on in the model. Below is the example of the markdown report for Decision Tree generated by mljar-supervised.
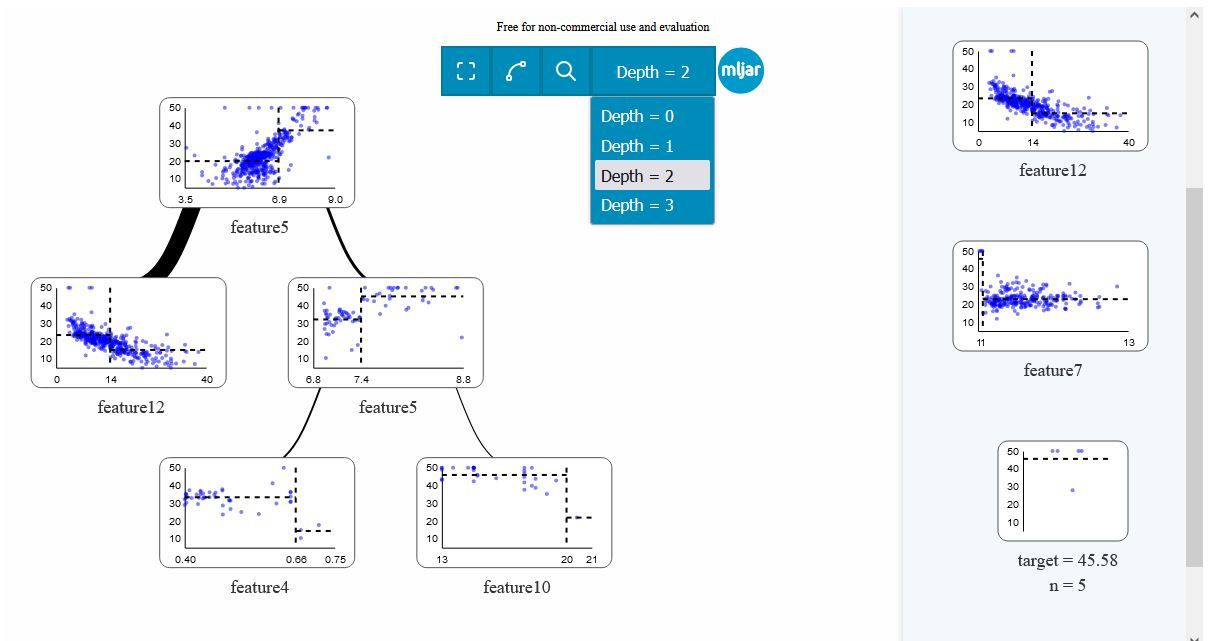
Thankfully we can use super tree and change dynamicaly depth of the tree.
 Train model
model = DecisionTreeRegressor(max_depth=3, random_state=1234)
model.fit(X, y)

# Initialize supertree
super_tree = SuperTree(model, X, y)

# show tree in your notebook
super_tree.save_html()
We recommend using it for the convenience and insight you get from overlaying data shown by putting the cursor over an element on the plots.
AI Data Analyst on Your Computer
Use MLJAR Studio to explore data, find insights, and create reports with AI. Everything runs locally, so your data stays with you.
About the Author

Related Articles
- Does Random Forest overfit?
- Random Forest vs AutoML (with python code)
- Random Forest vs Neural Network (classification, tabular data)
- List 12 AutoML software and services
- Compare MLJAR with Google AutoML Tables
- How to reduce memory used by Random Forest from Scikit-Learn in Python?
- How to save and load Random Forest from Scikit-Learn in Python?
- Random Forest Feature Importance Computed in 3 Ways with Python
- How to visualize a single Decision Tree from the Random Forest in Scikit-Learn (Python)?
- How many trees in the Random Forest?