Random Forest Feature Importance Computed in 3 Ways with Python
The feature importance (variable importance) describes which features are relevant. It can help with better understanding of the solved problem and sometimes lead to model improvements by employing the feature selection. In this post, I will present 3 ways (with code examples) how to compute feature importance for the Random Forest algorithm from scikit-learn package (in Python).
You will learn how to compute and plot:
- Feature Importance built-in the Random Forest algorithm,
- Feature Importance computed with Permutation method,
- Feature Importance computed with
SHAPvalues.
Random Forest Built-in Feature Importance
The Random Forest algorithm has built-in feature importance which can be computed in two ways:
- Gini importance (or mean decrease impurity), which is computed from the Random Forest structure. Let's look how the Random Forest is constructed. It is a set of Decision Trees. Each Decision Tree is a set of internal nodes and leaves. In the internal node, the selected feature is used to make decision how to divide the data set into two separate sets with similars responses within. The features for internal nodes are selected with some criterion, which for classification tasks can be gini impurity or infomation gain, and for regression is variance reduction. We can measure how each feature decrease the impurity of the split (the feature with highest decrease is selected for internal node). For each feature we can collect how on average it decreases the impurity. The average over all trees in the forest is the measure of the feature importance. This method is available in
scikit-learnimplementation of the Random Forest (for both classifier and regressor). It is worth to mention, that in this method we should look at relative values of the computed importances. This biggest advantage of this method is a speed of computation - all needed values are computed during the Radom Forest training. The drawbacks of the method is to tendency to prefer (select as important) numerical features and categorical features with high cardinality. What is more, in the case of correlated features it can select one of the feature and neglect the importance of the second one (which can lead to wrong conclusions). - Mean Decrease Accuracy - is a method of computing the feature importance on permuted out-of-bag (OOB) samples based on mean decrease in the accuracy. This method is not implemented in the
scikit-learnpackage. The very similar to this method is permutation based importance described below in this post.
I will show how to compute feature importance for the Random Forest with scikit-learn package and Boston dataset (house price regression task).
# Let's load the packages
import numpy as np
import pandas as pd
from sklearn.datasets import load_boston
from sklearn.model_selection import train_test_split
from sklearn.ensemble import RandomForestRegressor
from sklearn.inspection import permutation_importance
import shap
from matplotlib import pyplot as plt

plt.rcParams.update({'figure.figsize': (12.0, 8.0)})
plt.rcParams.update({'font.size': 14})
Load the data set and split for training and testing.
boston = load_boston()
X = pd.DataFrame(boston.data, columns=boston.feature_names)
y = boston.target
X_train, X_test, y_train, y_test = train_test_split(X, y, test_size=0.25, random_state=12)
Fit the Random Forest Regressor with 100 Decision Trees:
rf = RandomForestRegressor(n_estimators=100)
rf.fit(X_train, y_train)
To get the feature importances from the Random Forest model use the feature_importances_ attribute:
rf.feature_importances_
array([0.04054781, 0.00149293, 0.00576977, 0.00071805, 0.02944643,
       0.25261155, 0.01969354, 0.05781783, 0.0050257 , 0.01615872,
       0.01066154, 0.01185997, 0.54819617])
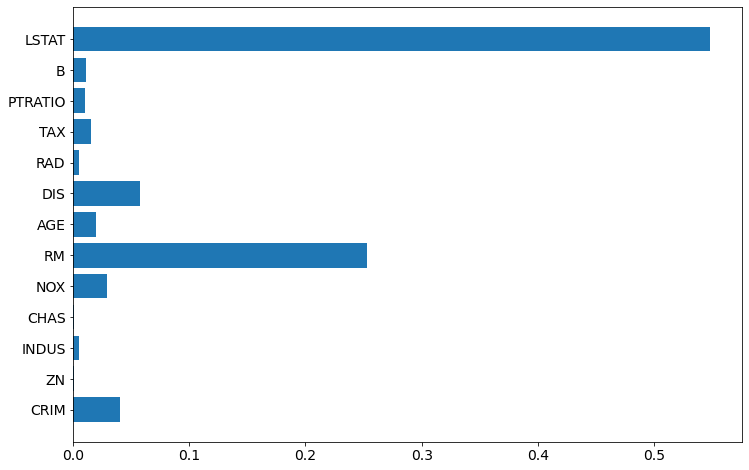
Let's plot the importances (chart will be easier to interpret than values).
plt.barh(boston.feature_names, rf.feature_importances_)
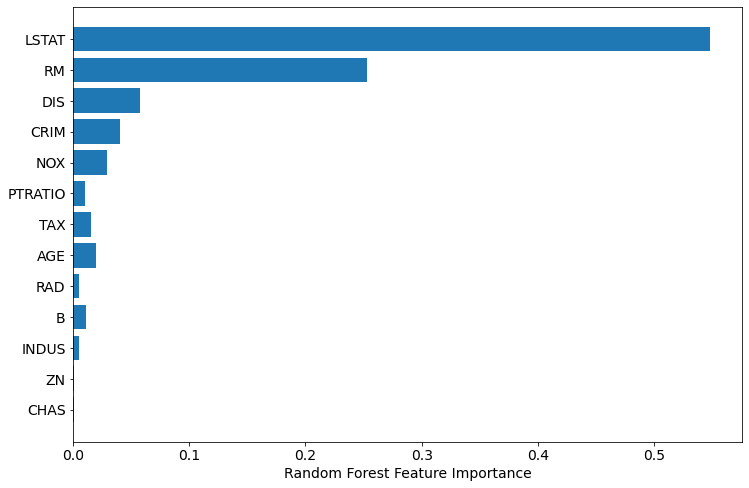
To have even better chart, let's sort the features, and plot again:
sorted_idx = rf.feature_importances_.argsort()
plt.barh(boston.feature_names[sorted_idx], rf.feature_importances_[sorted_idx])
plt.xlabel("Random Forest Feature Importance")
Permutation Based Feature Importance (with scikit-learn)
The permutation based importance can be used to overcome drawbacks of default feature importance computed with mean impurity decrease. It is implemented in scikit-learn as permutation_importance method. As arguments it requires trained model (can be any model compatible with scikit-learn API) and validation (test data). This method will randomly shuffle each feature and compute the change in the model's performance. The features which impact the performance the most are the most important one.
The permutation importance can be easily computed:
perm_importance = permutation_importance(rf, X_test, y_test)
To plot the importance:
sorted_idx = perm_importance.importances_mean.argsort()
plt.barh(boston.feature_names[sorted_idx], perm_importance.importances_mean[sorted_idx])
plt.xlabel("Permutation Importance")
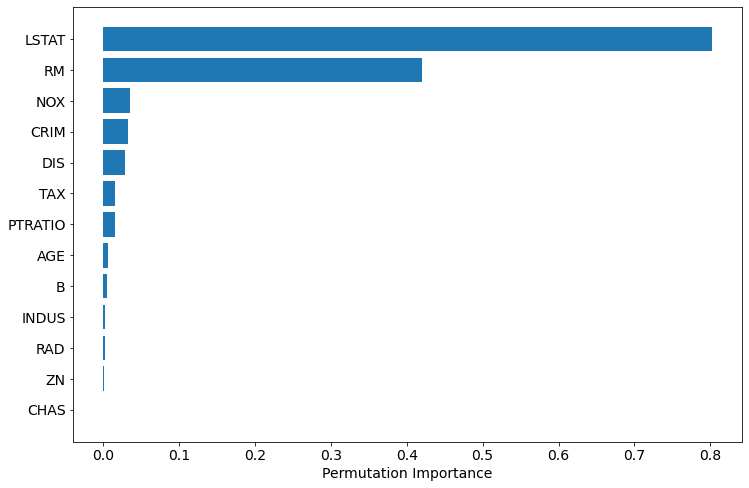
The permutation based importance is computationally expensive. The permutation based method can have problem with highly-correlated features, it can report them as unimportant.
Feature Importance Computed with SHAP Values
The SHAP interpretation can be used (it is model-agnostic) to compute the feature importances from the Random Forest. It is using the Shapley values from game theory to estimate the how does each feature contribute to the prediction. It can be easily installed (pip install shap) and used with scikit-learn Random Forest:
explainer = shap.TreeExplainer(rf)
shap_values = explainer.shap_values(X_test)
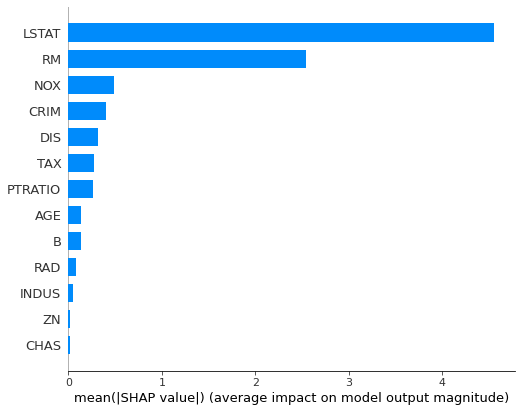
To plot feature importance as the horizontal bar plot we need to use summary_plot method:
shap.summary_plot(shap_values, X_test, plot_type="bar")
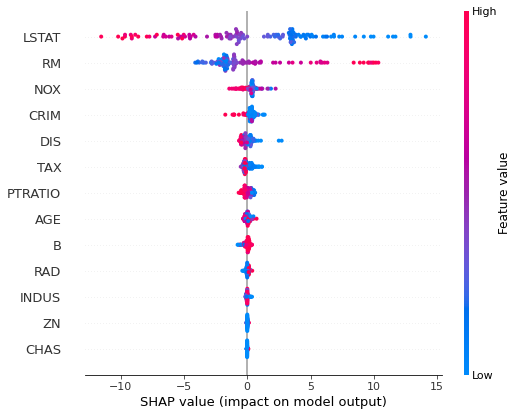
The feature importance can be plotted with more details, showing the feature value:
shap.summary_plot(shap_values, X_test)
The computing feature importances with SHAP can be computationally expensive. However, it can provide more information like decision plots or dependence plots.
Summary
The 3 ways to compute the feature importance for the scikit-learn Random Forest were presented:
- built-in feature importance
- permutation based importance
- importance computed with SHAP values
In my opinion, it is always good to check all methods, and compare the results. I'm using permutation and SHAP based methods in MLJAR's AutoML open-source package mljar-supervised. I'm using them becasue they are model-agnostic and works well with algorithms not from scikit-learn: Xgboost, Neural Networks (keras+tensorflow), LigthGBM, CatBoost.
Maybe you will find interesting article about the Random Forest Regressor and when does it fail and why?
Important Notes
- The more accurate model is, the more trustworthy computed importances are.
- The computed importances describe how important features are for the machine learning model. It is an approximation of how important features are in the data.
AI Data Analyst on Your Computer
Use MLJAR Studio to explore data, find insights, and create reports with AI. Everything runs locally, so your data stays with you.
About the Author

Related Articles
- List 12 AutoML software and services
- Compare MLJAR with Google AutoML Tables
- Visualize a Decision Tree in 5 Ways with Scikit-Learn and Python
- How to reduce memory used by Random Forest from Scikit-Learn in Python?
- How to save and load Random Forest from Scikit-Learn in Python?
- How to visualize a single Decision Tree from the Random Forest in Scikit-Learn (Python)?
- How many trees in the Random Forest?
- Xgboost Feature Importance Computed in 3 Ways with Python
- AutoML as easy as MLJar
- PostgreSQL and Machine Learning