The 2 alternative approaches for Jupyter Notebook widgets
 The Jupyter notebooks provide great flexibility for developing Python programs. The code is organised in cells, and execution results are presented just below the cell. This approach gains huge trackion among programmers, especially data scientists, around the globe. To make the notebooks more accessible to non-programmers there is possible to add an interactive widgets to the notebook. What is more, such notebook can be shared as standalone web application, which greatly simplifies the sharing. In this article I will present two alternative approaches for adding widgets into Jupyter Notebook, namely ipywidgets+Voila and Mercury.
Ipywidgets with Voila
The first approach is to use ipywidgets and Voila framework. The ipywidgets provides a way to add widgets in the notebook with Python. The widgets need to be connected with code, there are observe, interact methods and handlers. Let's write a simple notbook with ipywidgets and serve it with Voila - as they said, the code is worth thousand words :)
I will create a very similar notebook as Semi Koen in her article Bring your Jupyter Notebook to life with interactive widgets. It will be a simple application to filter the data. The data is about London international visitors. The notebook will filter visitors information based on year and visit purpose. You can access data from the website or my GitHub repository.
Let's load the packages and data:
# needed packages
import pandas as pd
import numpy as np
from ipywidgets import widgets

# load data
df_london = pd.read_csv("data/international-visitors-london-raw.csv")
The next step is to initialize the widgets:
# get list of unique values with ALL string
ALL = 'ALL'
def unique_sorted_values_plus_ALL(array):
    unique = array.unique().tolist()
    unique.sort()
    unique.insert(0, ALL)
    return unique

# initialize widgets
dropdown_year = widgets.Dropdown(options = unique_sorted_values_plus_ALL(df_london.year))
dropdown_purpose = widgets.Dropdown(options = unique_sorted_values_plus_ALL(df_london.purpose))
bounded_num = widgets.BoundedFloatText(min=0, max=100000, value=5, step=1)

# output widget
output = widgets.Output()
The widget construction is simple, create it as an object with class corresponding to the widget type (for example Dropdown or BoundedFloatText). Let's add methods for data filtering based on widgets values:
# set color of values in the data frame
def colour_ge_value(value, comparison):
    if value >= comparison:
        return 'color: red'
    else:
        return 'color: black'

# filter data
def common_filtering(year, purpose, num):
    output.clear_output()

    if (year == ALL) & (purpose == ALL):
        common_filter = df_london
    elif year == ALL:
        common_filter = df_london[df_london.purpose == purpose]
    elif purpose == ALL:
        common_filter = df_london[df_london.year == year]
    else:
        common_filter = df_london[
            (df_london.year == year) & (df_london.purpose == purpose)
        ]

    with output:
        print("Data set size", common_filter.shape)
        display(
            common_filter.head(20).style.applymap(
                lambda x: colour_ge_value(x, num), subset=["visits", "spend", "nights"]
            )
        )
OK, the code for data filtering is ready. We need one more step. We need to connect widgets with the notebook code. We will use event handlers and oberve method.
# define event handlers
def dropdown_year_eventhandler(change):
    common_filtering(change.new, dropdown_purpose.value, bounded_num.value)


def dropdown_purpose_eventhandler(change):
    common_filtering(dropdown_year.value, change.new, bounded_num.value)


def bounded_num_eventhandler(change):
    common_filtering(dropdown_year.value, dropdown_purpose.value, change.new)

# define observers
dropdown_year.observe(dropdown_year_eventhandler, names="value")
dropdown_purpose.observe(dropdown_purpose_eventhandler, names="value")
bounded_num.observe(bounded_num_eventhandler, names="value")
Is that all? Not, yet, the last step is to display widgets and output:
# display input widgets
display(dropdown_year)
display(dropdown_purpose)
display(bounded_num)

# display output widget
display(output)
The full notebook code is available on the GitHub. Here is how it looks like:
Great, the notebook is ready. We can now use the Voila to serve it as a web application. It's pretty simple, just run:
voila dashboard_ipywidgets.ipynb
It will serve the application at local address http://localhost:8866/. Below is the screenshot from the application.

You can interact with widgets and the output will be automatically updated.
Mercury
The second approach is to use the open-source framework called Mercury. The Mercury adds interactive widgets to the notebook based on YAML header (inserted in the first raw cell). We will reuse the code from previous example, except parts with ipywidgets. Let's start from the beginning.
The first step is to define the YAML configuration in the first cell of the notebook. Please make sure that the cell type is selected RAW. Below is the Mercury config used to generate the widgets.
---
title: London visitors
description: International London visitors dashboard
show-code: False
params:
    year:
        input: select
        label: Please select a year
        value: ALL
        choices: ['ALL', '2002', '2003', '2004', '2005', '2006', '2007', '2008', '2009', '2010', '2011', '2012', '2013', '2014', '2015', '2016', '2017', '2018', '2019', '2020P']
    purpose:
        input: select
        label: Please select a purpose
        value: ALL
        choices: ['ALL', 'Business', 'Holiday', 'Miscellaneous', 'Study', 'VFR']
    num:
        input: numeric
        value: 5
        label: Please select a num filtering
        min: 0
        max: 100000
        step: 1
---
After YAML header definition we just write the Python code.
# import packages
import pandas as pd
import numpy as np
from ipywidgets import widgets

# load data
df_london = pd.read_csv("data/international-visitors-london-raw.csv")

# set constant
ALL = "ALL"
Define variables that corresponds to widgets. Each widget name from YAML is the variable in the Python code:
year = ALL
purpose = ALL
num = 5
Please note that all variables are defined in the one cell. In the cell with variables should be only them. The Mercury framework will update the variables values based on widget values. (No need to write handlers or observers)
The filtering code:
def colour_ge_value(value, comparison):
    if value >= comparison:
        return "color: red"
    else:
        return "color: black"

def common_filtering(year, purpose, num):

    if (year == ALL) & (purpose == ALL):
        common_filter = df_london
    elif year == ALL:
        common_filter = df_london[df_london.purpose == purpose]
    elif purpose == ALL:
        common_filter = df_london[df_london.year == year]
    else:
        common_filter = df_london[
            (df_london.year == year) & (df_london.purpose == purpose)
        ]

    print("Data set size", common_filter.shape)
    return common_filter.head(20).style.applymap(
        lambda x: colour_ge_value(x, num), subset=["visits", "spend", "nights"]
    )
The function call with variables that are connected to widgets:
common_filtering(year, purpose, num)
The whole notebook:
To run notebook as web app in the development mode:
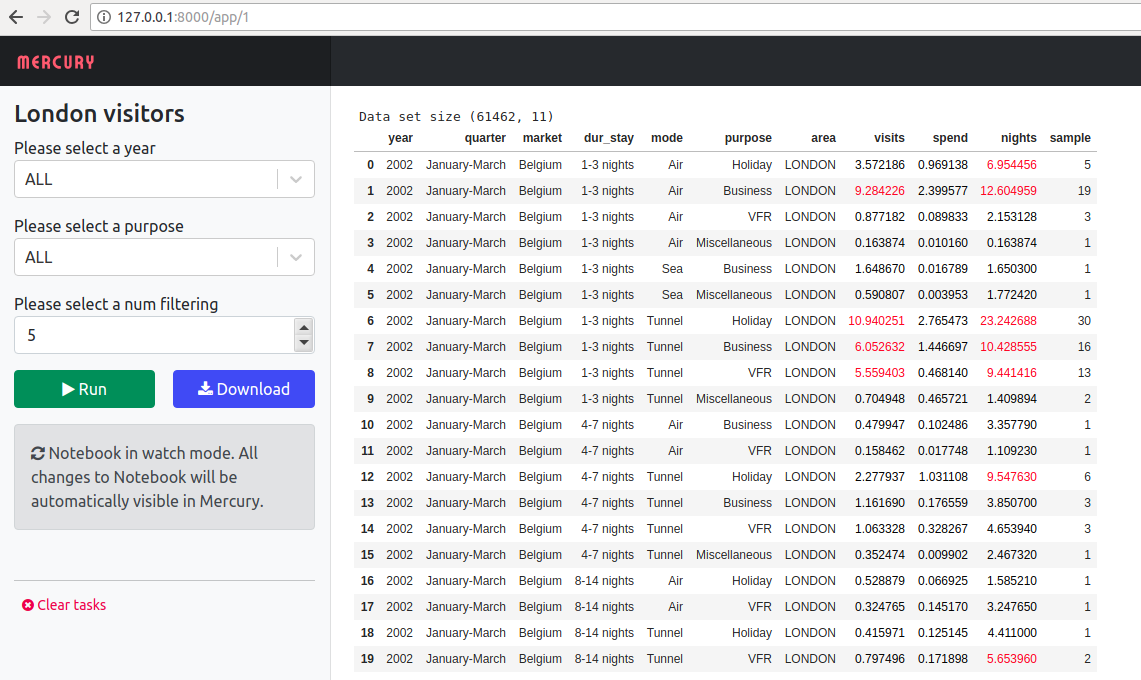
mercury watch dashboard_mercury.ipynb
You will see app running at local address http://127.0.0.1:8000 with similar view as in the screen below:
Compare ipywidgets+Voila vs Mercury
TLDR; We can summarize the comparison of ipywidgets+Voila vs Mercury in the table below.
| Feature | ipywidgets+Voila | Mercury |
|---|---|---|
| Interactive widgets | ✔ | ✔ |
| Development mode | ✔ | ✔ |
| Code separation | ✖ | ✔ |
| Serve multiple apps | ✖ | ✔ |
Interactive widgets
Both approaches provides interactive widgets. The ipywidgets have instant change after the widget's value change. Only selected part of the notebook will be executed after widget change. If the recomputed part of the code is computationally heavy then notebook can hang. In the Mercury you need to set all widgets values and click the Run button. After execution request the whole notebook from the top to the bottom is executed. There is no option to set dynamic values in the widgets in the Mercury.
Both approaches provides solution to upload and download files in the notebook. Although, the Mercury has special application view for the files created in the notebook. User can save any file in the special Output files directory and all files in this directory will be available for download (no need to do extra coding).
Development mode
Both approaches have development mode available. You can use ipywidgets during the notebook development. If there is a change in the notebook and you would like to see it in the Voila, then you need to manually refresh the website. In the Mercury framework there is watch command for developing User Interface in the notebook. It monitors changes in the notebook code, and reload the notebook automatically if needed.
GUI code separation from analytics code
It is important in software engineering to keep code clean and in separated parts. In the case of ipywidgtes the code for User Interface is mixed with code used for anaylitics. In complex projects this can be a drawback. In the Mercury framework, all code needed to generate widgets is in the first cell in the YAML header. The widgets values are used as variables in the code. There is clean separation between GUI code and analytics code.
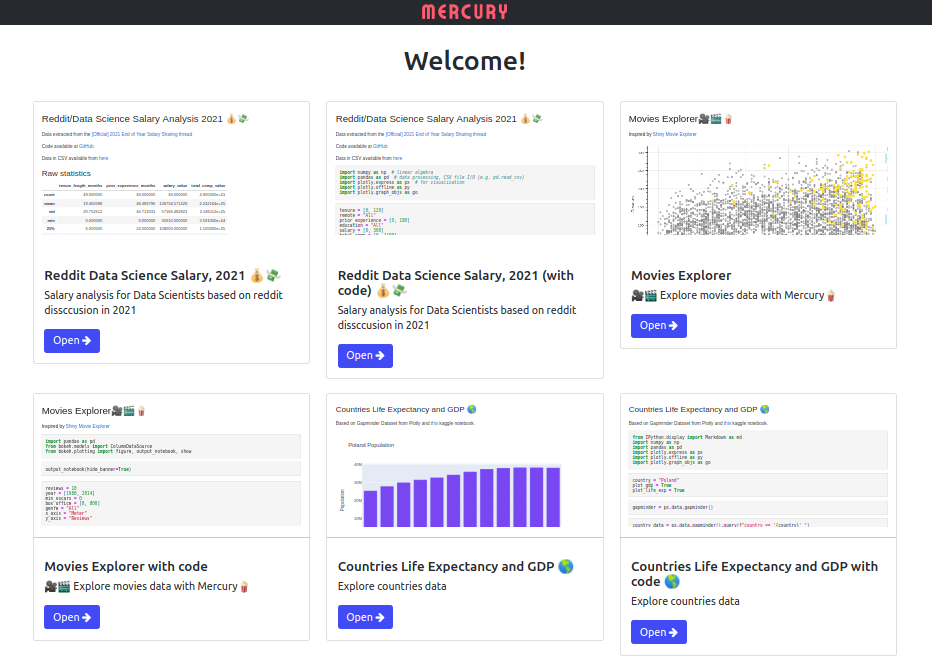
Serve multiple apps
There is no option to serve mutliple notebooks in the Voila framework. You can serve only one notebook. In the Mercury there is built-in app gallery. You can serve as many notebooks-apps as you want. Below is the example screenshot with Mercury app gallery. Each notebook is a separate card with a small preview.
Summary
The Jupyter Notebook is a great tool for development and data analytics. The process of sharing the notebook is cumbersome. Thanks to tools like ipywidgets+Voila and Mercury the results of analysis can be easily shared as web app. This is great news for all non-coding persons that will be able to interact with notebooks via widgets.
AI Data Analyst on Your Computer
Use MLJAR Studio to explore data, find insights, and create reports with AI. Everything runs locally, so your data stays with you.
About the Author

Related Articles
- Python Virtual Environment Explained
- Share Jupyter Notebook as web app
- File upload widget in Jupyter Notebook web app
- Build Computer Vision Web App with Python, OpenCV and Mercury
- Develop NLP Web App from Python Notebook
- The ipynb Jupyter Notebook File Extension
- How to create Mercury private fork and customize?
- PDF cheatsheets for 32 Jupyter Notebook Shortcuts
- The 8 surprising ways how to use Jupyter Notebook
- The 7 ways to run Jupyter Notebook online