Mar 02 2024 · Aleksandra Płońska, Karol Falkowski
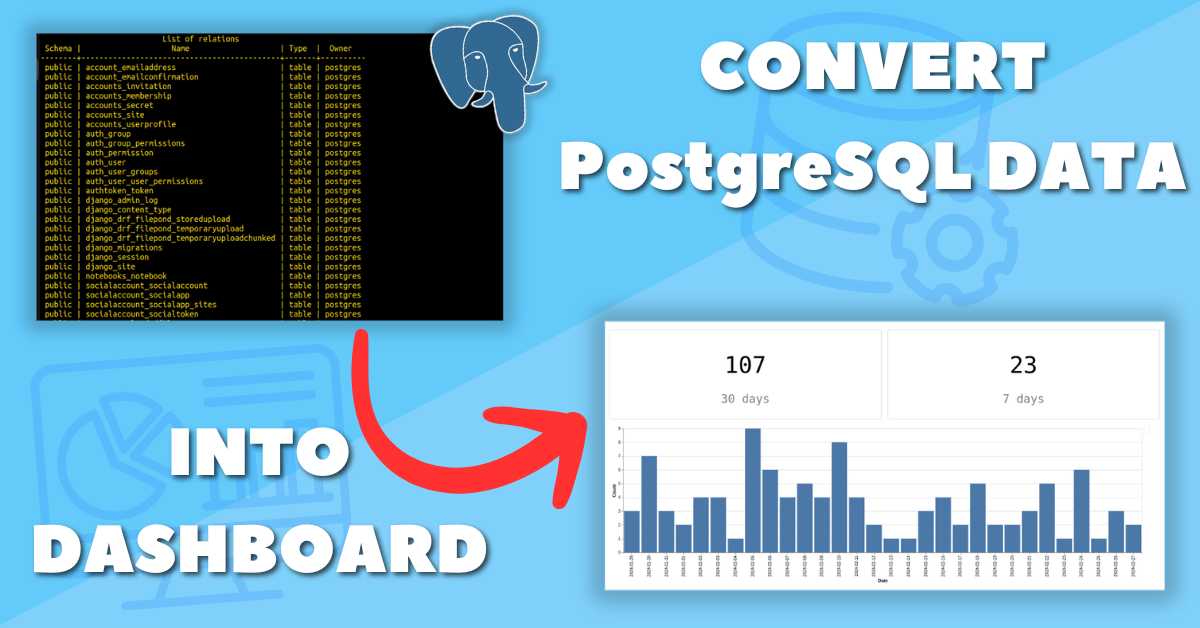
How to create Dashboard in Python from PostgreSQL
Convert your PostgreSQL data into Dashboard in Jupyter Notebook using Python. Deploy notebook as web app with Mercury Cloud.
Convert your PostgreSQL data into Dashboard in Jupyter Notebook using Python. Deploy notebook as web app with Mercury Cloud.

Learn how to detect and monitor data drift in Python with a dashboard workflow for reliable model performance over time.
Learn how to create a dashboard in Python with Jupyter Notebook, including interactive components and sharing options.
Build a Python dashboard with automatic updates, data monitoring, and notifications using Jupyter Notebook and Mercury.