Xgboost Feature Importance Computed in 3 Ways with Python
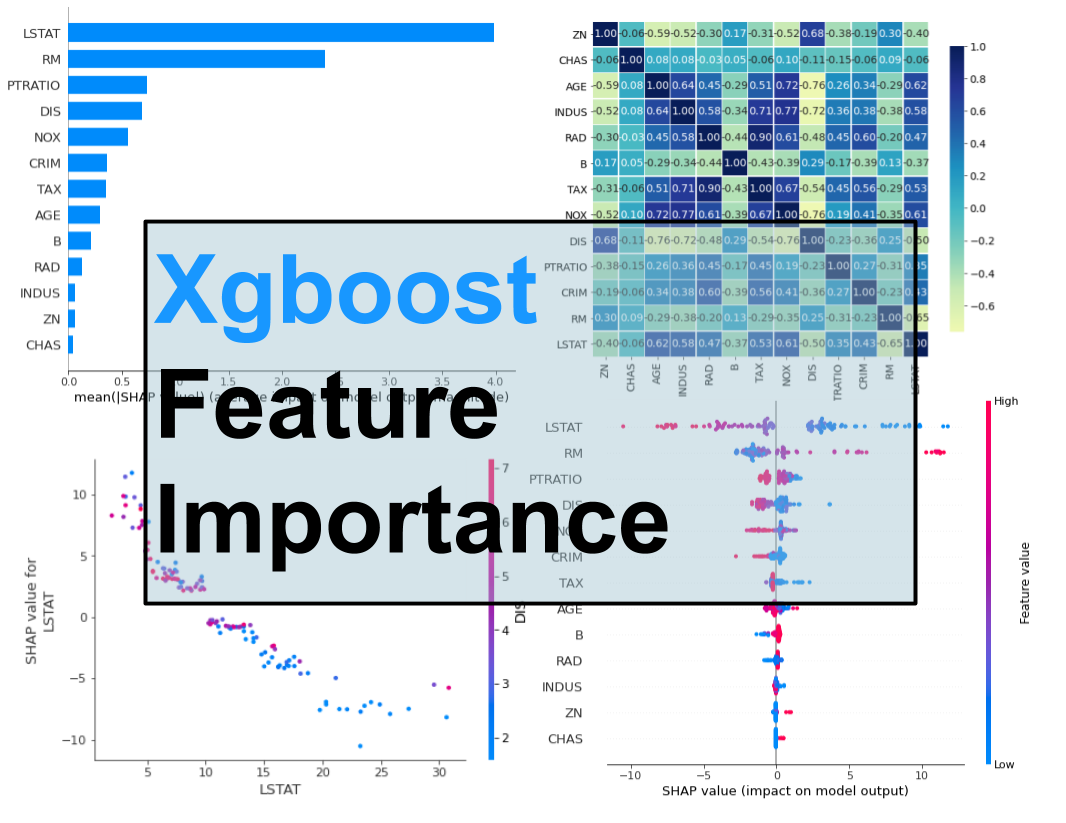 [Xgboost](https://xgboost.readthedocs.io/en/latest/) is a gradient boosting library. It provides parallel boosting trees algorithm that can solve Machine Learning tasks. It is available in many languages, like: C++, Java, Python, R, Julia, Scala. In this post, I will show you how to get feature importance from Xgboost model in Python. In this example, I will use `boston` dataset availabe in `scikit-learn` pacakge (a regression task).
You will learn how to compute and plot:
- Feature Importance built-in the Xgboost algorithm,
- Feature Importance computed with Permutation method,
- Feature Importance computed with
SHAPvalues.
All the code is available as Google Colab Notebook. Happy coding!
Xgboost Built-in Feature Importance
Let's start with importing packages. Please note that if you miss some package you can install it with pip (for example, pip install shap).
import numpy as np
import pandas as pd
import shap

from sklearn.datasets import load_boston
from sklearn.model_selection import train_test_split
from sklearn.inspection import permutation_importance
from matplotlib import pyplot as plt
import seaborn as sns # for correlation heatmap

from xgboost import XGBRegressor
Load the boston data set and split it into training and testing subsets. The 75% of data will be used for training and the rest for testing (will be needed in permutation-based method).
boston = load_boston()
X = pd.DataFrame(boston.data, columns=boston.feature_names)
y = boston.target
X_train, X_test, y_train, y_test = train_test_split(X, y, test_size=0.25, random_state=12)
Fitting the Xgboost Regressor is simple and take 2 lines (amazing package, I love it!):
xgb = XGBRegressor(n_estimators=100)
xgb.fit(X_train, y_train)
I've used default hyperparameters in the Xgboost and just set the number of trees in the model (n_estimators=100).
To get the feature importances from the Xgboost model we can just use the feature_importances_ attribute:
xgb.feature_importances_
array([0.01690426, 0.00777439, 0.0084541 , 0.04072201, 0.04373369,
       0.20451033, 0.01512331, 0.04763542, 0.01018296, 0.02332482,
       0.04085794, 0.01299683, 0.52778   ], dtype=float32)
It's is important to notice, that it is the same API interface like for 'scikit-learn' models, for example in Random Forest we would do the same to get importances.
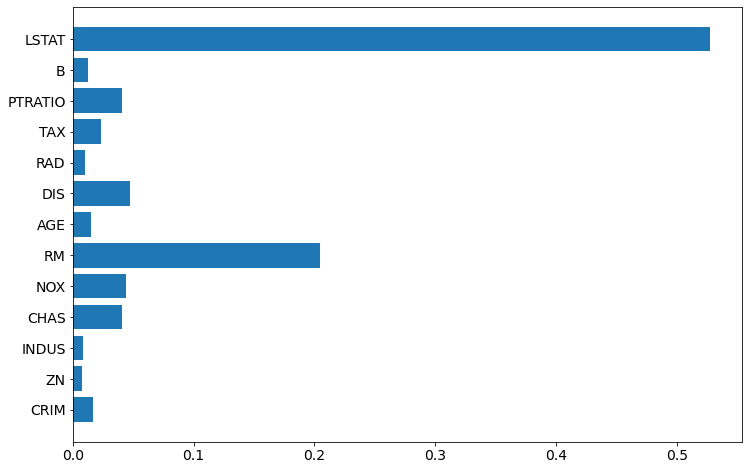
Let's visualize the importances (chart will be easier to interpret than values).
plt.barh(boston.feature_names, xgb.feature_importances_)
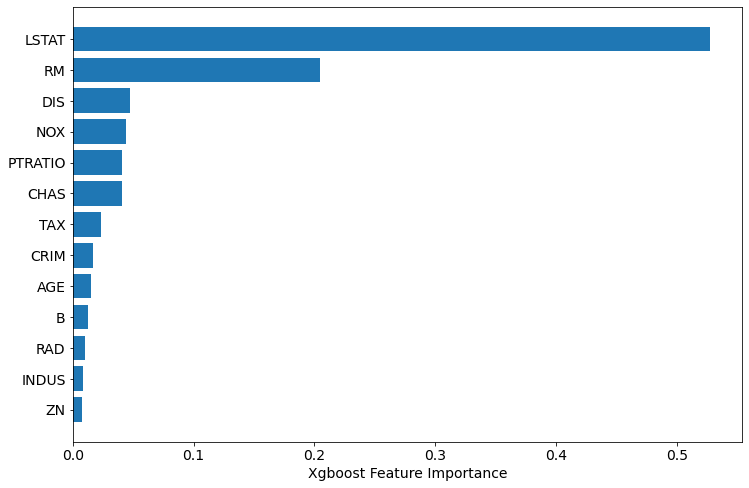
To have even better plot, let's sort the features based on importance value:
sorted_idx = xgb.feature_importances_.argsort()
plt.barh(boston.feature_names[sorted_idx], xgb.feature_importances_[sorted_idx])
plt.xlabel("Xgboost Feature Importance")
About Xgboost Built-in Feature Importance
- There are several types of importance in the Xgboost - it can be computed in several different ways. The default type is
gainif you construct model withscikit-learnlike API (docs). When you accessBoosterobject and get the importance withget_scoremethod, then default isweight. You can check the type of the importance withxgb.importance_type. - The
gaintype shows the average gain across all splits where feature was used. - The
weightshows the number of times the feature is used to split data. This type of feature importance can favourize numerical and high cardinality features. Be careful! - There are also
cover,total_gain,total_covertypes of importance.
Permutation Based Feature Importance (with scikit-learn)
Yes, you can use permutation_importance from scikit-learn on Xgboost! (scikit-learn is amazing!) It is possible because Xgboost implements the scikit-learn interface API. It is available in scikit-learn from version 0.22.
This permutation method will randomly shuffle each feature and compute the change in the model's performance. The features which impact the performance the most are the most important one.
The permutation importance for Xgboost model can be easily computed:
perm_importance = permutation_importance(xgb, X_test, y_test)
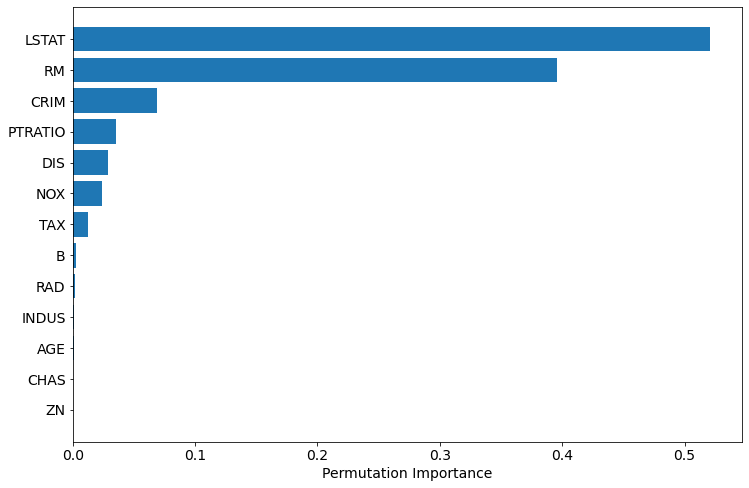
The visualization of the importance:
sorted_idx = perm_importance.importances_mean.argsort()
plt.barh(boston.feature_names[sorted_idx], perm_importance.importances_mean[sorted_idx])
plt.xlabel("Permutation Importance")
The permutation based importance is computationally expensive (for each feature there are several repeast of shuffling). The permutation based method can have problem with highly-correlated features. Let's check the correlation in our dataset:
def correlation_heatmap(train):
    correlations = train.corr()

    fig, ax = plt.subplots(figsize=(10,10))
    sns.heatmap(correlations, vmax=1.0, center=0, fmt='.2f', cmap="YlGnBu",
                square=True, linewidths=.5, annot=True, cbar_kws={"shrink": .70}
                )
    plt.show();

correlation_heatmap(X_train[boston.feature_names[sorted_idx]])
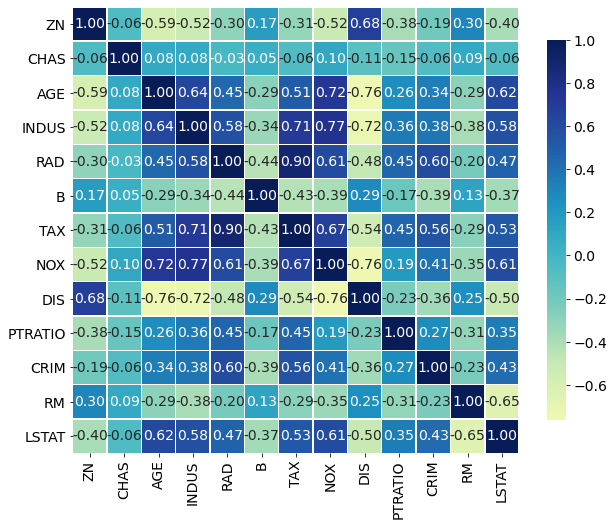
Based on above results, I would say that it is safe to remove: ZN, CHAS, AGE, INDUS. Their importance based on permutation is very low and they are not highly correlated with other features (abs(corr) < 0.8).
In AutoML package mljar-supervised, I do one trick for feature selection: I insert random feature to the training data and check which features have smaller importance than a random feature. I remove those from further training. The trick is very similar to one used in the Boruta algorihtm.
Feature Importance Computed with SHAP Values
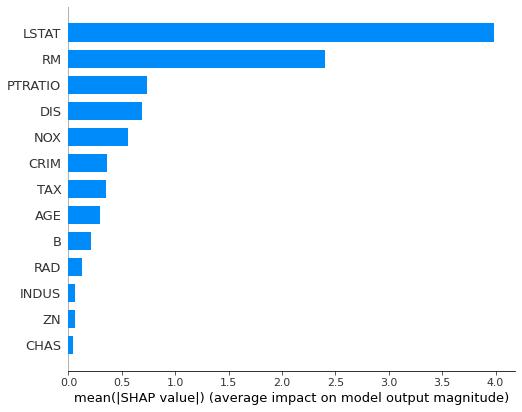
The third method to compute feature importance in Xgboost is to use SHAP package. It is model-agnostic and using the Shapley values from game theory to estimate the how does each feature contribute to the prediction.
explainer = shap.TreeExplainer(xgb)
shap_values = explainer.shap_values(X_test)
To visualize the feature importance we need to use summary_plot method:
shap.summary_plot(shap_values, X_test, plot_type="bar")
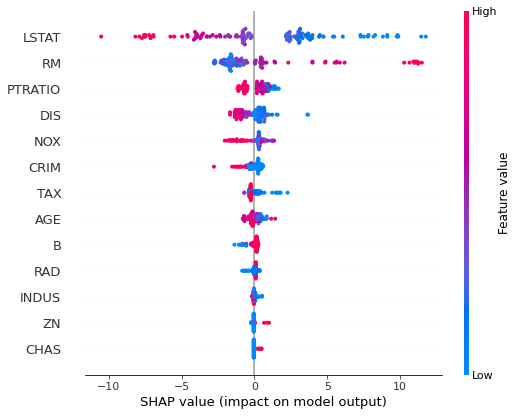
The nice thing about SHAP package is that it can be used to plot more interpretation plots:
shap.summary_plot(shap_values, X_test)
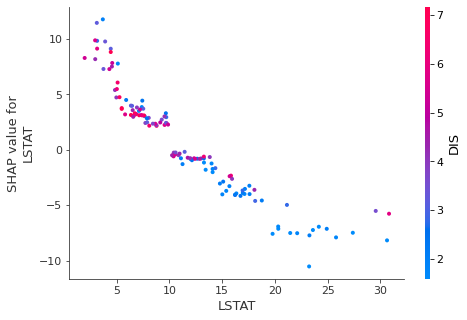
shap.dependence_plot("LSTAT", shap_values, X_test)
The computing feature importances with SHAP can be computationally expensive.
Summary
The are 3 ways to compute the feature importance for the Xgboost:
- built-in feature importance
- permutation based importance
- importance computed with SHAP values
In my opinion, it is always good to check all methods and compare the results. It is important to check if there are highly correlated features in the dataset. They can break the whole analysis.
Important Notes
- The more accurate model is, the more trustworthy computed importances are.
- Feature importance is an approximation of how important features are in the data.
About the Author

Related Articles
- How to reduce memory used by Random Forest from Scikit-Learn in Python?
- How to save and load Random Forest from Scikit-Learn in Python?
- Random Forest Feature Importance Computed in 3 Ways with Python
- How to visualize a single Decision Tree from the Random Forest in Scikit-Learn (Python)?
- How many trees in the Random Forest?
- AutoML as easy as MLJar
- PostgreSQL and Machine Learning
- Tensorflow vs Scikit-learn
- Extract Rules from Decision Tree in 3 Ways with Scikit-Learn and Python
- AutoML in the Notebook