The 3 ways to change figure size in Matplotlib
You've just created an amazing plot in Python with Matplotlib but would like to change figure size. I will show you three different approaches to changing figure size in Matplotlib. All code samples from article can be used in Python script or Jupyter Notebook (Jupyter Lab).
Important: The figure size in Matplotlib is in inches.
In all examples, I'm using Matplotlib in version 3.6.2.
# how to check your Matplotlib version
import matplotlib
print(matplotlin.__version__)

>> 3.6.2
You can create an empty figure to check the default width and height in Matplotlib:
from matplotlib import pytplot as plt

f = plt.figure()
print(f.get_figwidth(), f.get_figheight())

>> 6.0 4.0
On my system (Ubuntu 20.04, Python 3.8), the default figure size is 6.0 inches in width and 4.0 inches in height.
The figure also has a dpi parameter that can be adjusted with the figure size. The dpi is an acronym for dots per inch. It sets a number of pixels per inch. We need to multiply the figure size by dpi to get the figure size in pixels. On my system default dpi is 72.0:
from matplotlib import pytplot as plt

f = plt.figure()
print(f.get_dpi())

>> 72.0
Matplotlib dpi parameter can be used to scale fonts, line width, or marker size. It works as a magnifying glass. The figure size in Matplotlib depends on figsize and dpi.
The outline of methods to change figure size in Matplotlib:
- set
figsizeanddpiduring figure creation, - set size and
dpiwith setters functions:set_figwidth,set_figheight,set_size_inches,set_dpi, - set size and
dpifor all plots withrcParams.
1. Set figsize and dpi in the figure
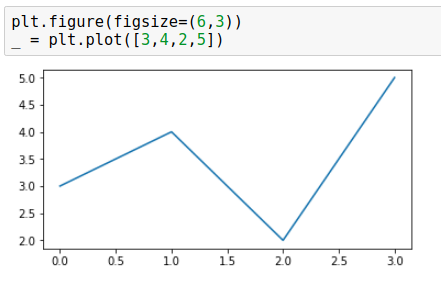
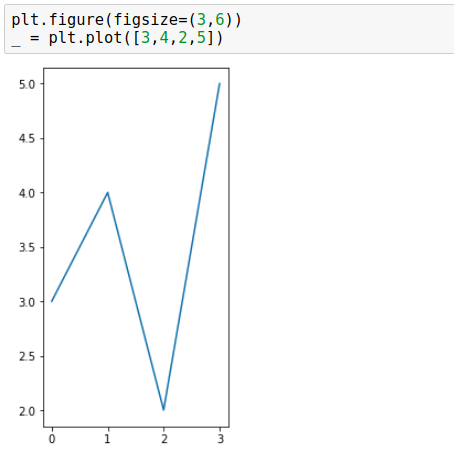
The most straightforward way to set figure size is to set a figsize argument when creating a new figure. Below are a few examples with different figure sizes.
plt.figure(figsize=(3, 3))
_ = plt.plot([3, 4, 2, 5])

plt.figure(figsize=(6, 3))
_ = plt.plot([3, 4, 2, 5])
plt.figure(figsize=(3, 6))
_ = plt.plot([3, 4, 2, 5])
The dpi can be passed as an argument to the figure() function. We can control the width of objects (axes, fonts, lines, markers) in the figure. Below are two figures, both having the same pixel size: 432x432 but different dpi and figsize values:
432x432=6x6*72,432x432=3x3*144.
plt.figure(figsize=(6, 6), dpi=72)
_ = plt.plot([3, 4, 2, 5])

plt.figure(figsize=(3, 3), dpi=144)
_ = plt.plot([3, 4, 2, 5])

As you can see in the above images, figure with a larger dpi has wider lines, axes, larger font, and fewer tick labels - dpi magnifies all elements. You can read an amazing explanation of the relationship between dpi and figsize in this StackOverflow response.
2. Use set_figwidth, set_figheight, set_size_inches, set_dpi
The next way to change figure size in Matplotlib is to use following functions:
set_figwidth- sets figure width in inches,set_figheight- sets figure height in inches,set_size_inches- set figure width and height in inches,set_dpi- sets figuredpi.
Below are two examples that change figure size and set dpi.
# create figure
f = plt.figure()

# set width, height, dpi
f.set_figwidth(4)
f.set_figheight(2)
f.set_dpi(142)

# plot
_ = plt.plot([3,4,2,5])

Change figure size with set_size_inches(w, h):
# create figure
f = plt.figure()

# set size, dpi
f.set_size_inches(4, 2)
f.set_dpi(142)

# plot
_ = plt.plot([3,4,2,5])

3. Change figure size with rcParams
The last option is to set figure size globally to all figures plotted in the script or notebook. We use this rcParams.
# set figsize and dpi for all figures
plt.rcParams["figure.figsize"] = (4,2)
plt.rcParams["figure.dpi"] = 144

This option sets figure size and dpi for all figures in the current script or notebook.
For Jupyter Notebook users: please set
rcParamsin a separate cell below imports. SettingrcParamsin the same cell asmatplotlibimport will not make any change.
Summary
Matplotlib is a popular plotting library for Python. You need to correctly understand the relationship between figure size and dpi to get the desired size of the plot. You can set figure size and dpi when creating a new figure. If you already have a figure created (or it was created by another package) then you can manipulate its size and dpi with set_figwidth, set_figheight, set_size_inches, set_dpi functions. There is an option to set figure size and dpi globally to all figures in the script (or notebook) by using rcParams.
Explore next
Continue with practical guides, tutorials, and product workflows for Python, AutoML, and local AI data analysis.
- AI Data Analyst
Analyze local data with conversational AI support and notebook-based, reproducible Python workflows.
- AutoLab Experiments
Run autonomous ML experiments, track iterations, and inspect results in transparent notebook outputs.
- MLJAR AutoML
Learn how to train, compare, and explain tabular machine learning models with open-source automation.
- Machine learning tutorials
Step-by-step guides for beginners and practitioners working with Python, AutoML, and data workflows.
Run AI for Machine Learning — Fully Local
MLJAR Studio is a private AI Python notebook for data analysis and machine learning. Generate code with AI, run experiments locally, and keep full control over your workflow.
About the Authors


Related Articles
- The 3 ways to hide code in Jupyter Notebook Presentation
- Convert Jupyter Notebook to spaCy NLP web application
- The 4 ways to run Jupyter Notebook in command line
- The 2 ways to convert Jupyter Notebook Presentation to PDF slides
- The 3 ways to share password protected Jupyter Notebook
- The 5 ways to publish Jupyter Notebook Presentation
- The 2 ways to save and load scikit-learn model
- Complete list of 594 PyTZ timezones
- Save a Plot to a File in Matplotlib (using 14 formats)
- Convert Jupyter Notebook to Python script in 3 ways