Decision Tree vs LightGBM
Decision Tree is a supervised algorithm used in machine learning. It is using a binary tree graph (each node has two children) to assign for each data sample a target value. The target values are presented in the tree leaves. To reach the leaf, the sample is propagated through nodes, starting at the root node. In each node a decision is made, to which descendant node it should go. A decision is made based on the selected sample’s feature. It is usually one feature used to make the decision (one feature is used in the node to make a decision). Decision tree learning is a process of finding the optimal rules in each internal tree node according to the selected metric.
References
- L. Breiman, J. Friedman, R. Olshen, and C. Stone, Classification and Regression Trees, 1984
- T. Hastie, R. Tibshirani and J. Friedman., Elements of Statistical Learning, Springer, 2009.
License
License for Scikit-Learn implementation of Decision Tree: New BSD License
LightGBM (Light Gradient Boosting Machine) is a Machine Learning library that provides algorithms under gradient boosting framework developed by Microsoft.
It works on Linux, Windows, macOS, and supports C++, Python, R and C#.
References
- Guolin Ke, Qi Meng, Thomas Finley, Taifeng Wang, Wei Chen, Weidong Ma, Qiwei Ye, Tie-Yan Liu, LightGBM: A Highly Efficient Gradient Boosting Decision Tree, NIPS 2017, pp. 3149-3157.
- Qi Meng, Guolin Ke, Taifeng Wang, Wei Chen, Qiwei Ye, Zhi-Ming Ma, Tie-Yan Liu, A Communication-Efficient Parallel Algorithm for Decision Tree, NIPS 2016, pp. 1279-1287.
License
MIT License
Binary classification
Decision Tree 0:19 LightGBM
Multiclass classification
Decision Tree 0:7 LightGBM
Regression
Decision Tree 0:16 LightGBM

Binary classification

Adult dataset
Metric: Accuracy
Decision Tree 0.84517 - vs - 0.87611 LightGBM
This is an Adult database. The prediction task is to determine whether a person makes over 50K a year. Data extraction was done by Barry Becker from the 1994 Census database. Variables are all self-explanatory except __fnlwgt__. This is a proxy for the people's demographic background: 'People with similar demographic characteristics should have similar weights.' This similarity-statement is not relevant in all the different 51 states.
Category: People
Rows: 48,842 Columns: 14
Available at OpenML: https://openml.org/d/1590

Amazon employee access dataset
Metric: Accuracy
Decision Tree 0.94211 - vs - 0.95062 LightGBM
This is an Amazon_employee_access database. The data consists of real historical data collected from 2010 & 2011. Employees are manually allowed or denied access to resources over time. The data is used to create an algorithm capable of learning from this historical data to predict approval/denial for employees' unseen set. There is a considerable amount of data regarding an employee’s role within an organization and the resources to which they have access. Given the data related to current employees and their provisioned access, models can be built that automatically determine access privileges as employees enter and leave roles within a company. These auto-access models seek to minimize the human involvement required to grant or revoke employee access.
Category: Technology
Rows: 32,769 Columns: 9
Available at OpenML: https://openml.org/d/4135

Aps failure dataset
Metric: Accuracy
Decision Tree 0.98893 - vs - 0.995 LightGBM
This is an APS Failure at Scania Trucks. The dataset consists of data collected from heavy Scania trucks in everyday usage. The system in focus is the Air Pressure system (APS), which generates pressurized air utilized in various functions in a truck, such as braking and gear changes. The datasets' positive class consists of component failures for a specific component of the APS system. The negative class consists of trucks with failures for components not related to the APS.
Category: Manufacturing
Rows: 76,000 Columns: 170
Available at OpenML: https://openml.org/d/41138
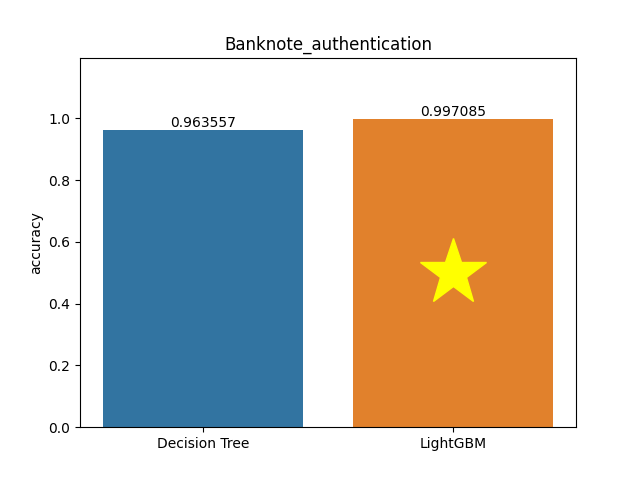
Banknote authentication dataset
Metric: Accuracy
Decision Tree 0.96356 - vs - 0.99708 LightGBM
This is a banknote-authentication. Dataset about distinguishing genuine and forged banknotes. Data were extracted from images that were taken from genuine and forged banknote-like specimens. For digitization, an industrial camera usually used for print inspection was used.
Category: Fintech
Rows: 1,372 Columns: 4
Available at OpenML: https://openml.org/d/1462
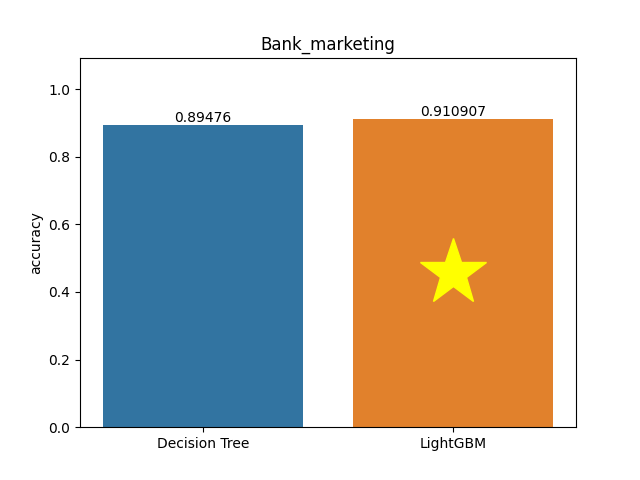
Bank marketing dataset
Metric: Accuracy
Decision Tree 0.89476 - vs - 0.91091 LightGBM
The Bank Marketing Dataset. The data is related to direct marketing campaigns of a Portuguese banking institution. The marketing campaigns were based on phone calls. More than one contact to the same client was often required to access if the product (bank term deposit) would be (or not) subscribed.
Category: Marketing
Rows: 45,211 Columns: 16
Available at OpenML: https://openml.org/d/1461

Bioresponse dataset
Metric: Accuracy
Decision Tree 0.76246 - vs - 0.81072 LightGBM
This is a Bioresponse database. Predict a biological response of molecules from their chemical properties. The first column contains experimental data describing an actual biological response; the molecule was seen to elicit this response (1) or not (0). The remaining columns represent molecular descriptors (d1 through d1776); these are calculated properties that can capture some of the molecule's characteristics - for example, size, shape, or elemental constitution. The descriptor matrix has been normalized.
Category: Technology
Rows: 3,751 Columns: 1,776
Available at OpenML: https://openml.org/d/4134

Churn dataset
Metric: Accuracy
Decision Tree 0.9218 - vs - 0.9618 LightGBM
This is a churn dataset. A dataset relating characteristics of telephony account features and usage and whether or not the customer churned.
Category: Marketing
Rows: 5,000 Columns: 20
Available at OpenML: https://openml.org/d/40701
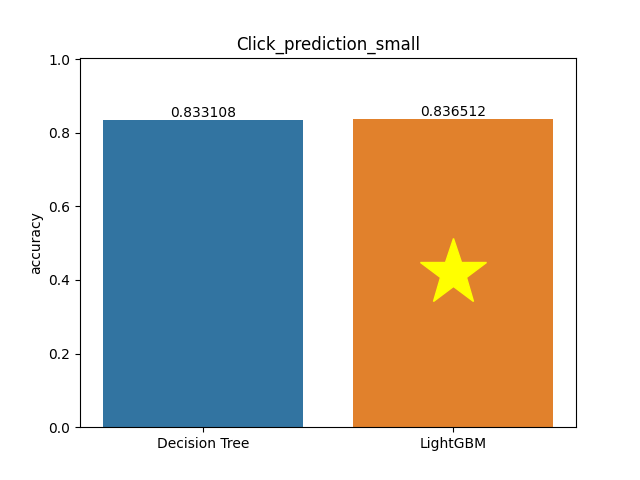
Click prediction small dataset
Metric: Accuracy
Decision Tree 0.83311 - vs - 0.83651 LightGBM
This is a Click_prediction_small database. This data is derived from the 2012 KDD Cup. The data is about advertisements shown alongside search results in a search engine and whether or not people clicked on these ads. A search session contains information on user id, the user's query, ads displayed to the user, and the target feature indicating whether a user clicked at least one of the ads in this session.
Category: Marketing
Rows: 39,948 Columns: 11
Available at OpenML: https://openml.org/d/1220
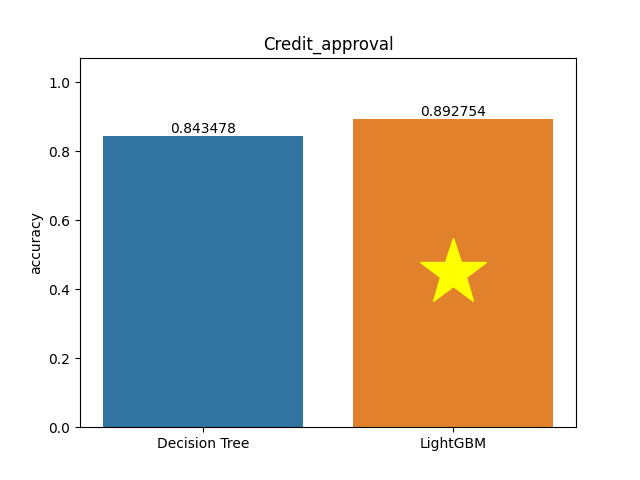
Credit approval dataset
Metric: Accuracy
Decision Tree 0.84348 - vs - 0.89275 LightGBM
This is a credit-approval dataset. This file concerns credit card applications. All attribute names and values have been changed to meaningless symbols to protect the confidentiality of the data.
Category: Banking
Rows: 690 Columns: 15
Available at OpenML: https://openml.org/d/29

Credit g dataset
Metric: Accuracy
Decision Tree 0.727 - vs - 0.788 LightGBM
This is a German Credit dataset. It classifies people described by a set of attributes as good or bad credit risks. This dataset contains such information as a type of job, age, credit history.
Category: Banking
Rows: 1000 Columns: 20
Available at OpenML: https://openml.org/d/31

Diabetes dataset
Metric: Accuracy
Decision Tree 0.7487 - vs - 0.79297 LightGBM
This is a Pima Indians Diabetes Database. According to World Health Organization criteria, the diagnostic, binary-valued variable investigated is whether the patient shows signs of diabetes.
Category: Healthcare
Rows: 768 Columns: 8
Available at OpenML: https://openml.org/d/37

Electricity dataset
Metric: Accuracy
Decision Tree 0.7626 - vs - 0.94381 LightGBM
This is an Electricity dataset. This data was collected from the Australian New South Wales Electricity Market. In this market, prices are not fixed and are affected by the market's demand and supply. They are set every five minutes. Electricity transfers to/from the neighboring state of Victoria were done to alleviate fluctuations.
Category: Energy
Rows: 45,312 Columns: 8
Available at OpenML: https://openml.org/d/151
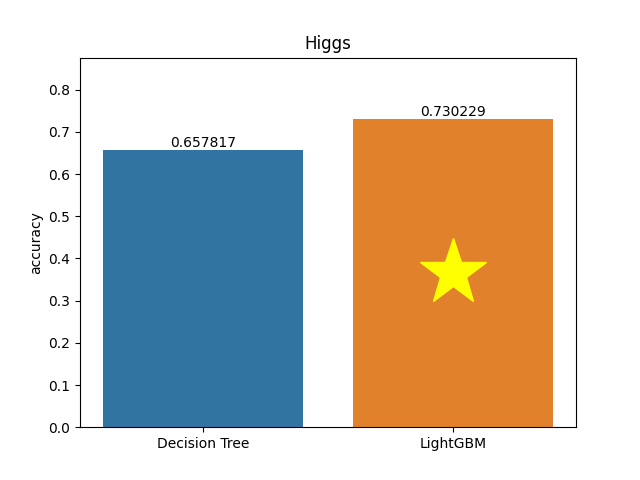
Higgs dataset
Metric: Accuracy
Decision Tree 0.65782 - vs - 0.73023 LightGBM
This is a Higgs database. Higgs Boson detection data. The data has been produced using Monte Carlo simulations.
Category: Science
Rows: 98,050 Columns: 28
Available at OpenML: https://openml.org/d/23512

Internet advertisements dataset
Metric: Accuracy
Decision Tree 0.96279 - vs - 0.98048 LightGBM
This dataset represents a set of possible advertisements on Internet pages. The features encode the image's geometry (if available) as well as phrases occurring in the URL, the image's URL and alt text, the anchor text, and words occurring near the anchor text. The task is to predict whether an image is an advertisement ('ad') or not ('nonad').
Category: Marketing
Rows: 3,279 Columns: 1,558
Available at OpenML: https://openml.org/d/40978

Kddcup09 churn dataset
Metric: Accuracy
Decision Tree 0.92656 - vs - 0.92762 LightGBM
This is a KDDCup09_churn database. The KDD Cup 2009 offers the opportunity to work on large marketing databases from the French Telecom company Orange to predict customers' propensity to switch providers (churn). Churn is one of two primary factors that determine the steady-state level of customers a business will support. In its broadest sense, the churn rate is a measure of the number of individuals or items moving into or out of a collection over a specific period of time.
Category: Marketing
Rows: 50,000 Columns: 230
Available at OpenML: https://openml.org/d/1112

Kddcup09 upselling dataset
Metric: Accuracy
Decision Tree 0.95088 - vs - 0.95168 LightGBM
This is a KDDCup09_upselling database. Customer Relationship Management (CRM) is a key element of modern marketing strategies. The KDD Cup 2009 offers the opportunity to work on large marketing databases from the French Telecom company Orange to predict the propensity of customers to switch provider (churn), buy new products or services (appetency), or buy upgrades or add-ons proposed to them to make the sale more profitable (up-selling).
Category: Marketing
Rows: 50,000 Columns: 230
Available at OpenML: https://openml.org/d/1114
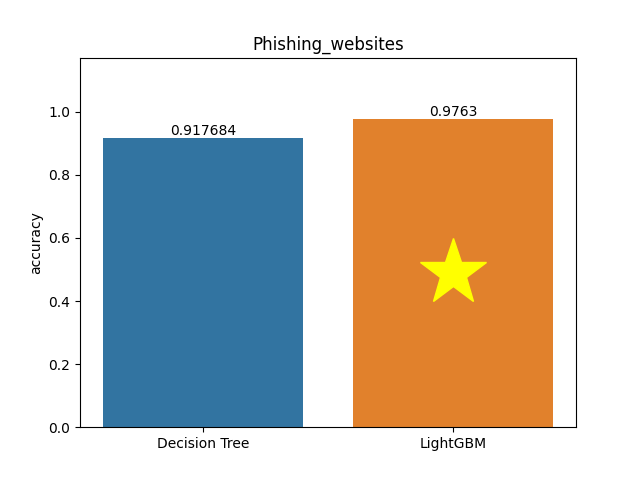
Phishing websites dataset
Metric: Accuracy
Decision Tree 0.91768 - vs - 0.9763 LightGBM
This is the Phishing Websites Data. There's plenty of articles about predicting phishing websites have been disseminated these days; no reliable training dataset has been published publically, maybe because there is no agreement in the literature on the definitive features that characterize phishing webpages. Hence it is difficult to shape a dataset that covers all possible features. In this dataset, the authors shed light on the important features that have proved to be sound and effective in predicting phishing websites.
Category: Web
Rows: 11,055 Columns: 30
Available at OpenML: https://openml.org/d/4534

Spambase dataset
Metric: Accuracy
Decision Tree 0.90263 - vs - 0.9624 LightGBM
This is a SPAM E-mail Database. This collection of spam e-mails came from postmasters and individuals who had filed spam. Collection of non-spam e-mails came from filed work and personal e-mails, and hence the word 'george' and the area code '650' are indicators of non-spam. These are useful when constructing a personalized spam filter. One would either have to blind such non-spam indicators or get an extensive collection of non-spam to generate a general-purpose spam filter.
Category: Technology
Rows: 4,601 Columns: 57
Available at OpenML: https://openml.org/d/44
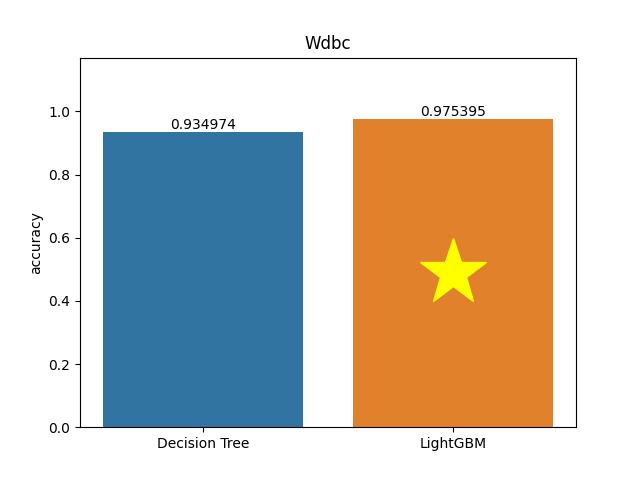
Wdbc dataset
Metric: Accuracy
Decision Tree 0.93497 - vs - 0.9754 LightGBM
This is a WDBC dataset (Wisconsin Diagnostic Brest Cancer). Features are computed from a digitized image of a fine needle aspirate (FNA) of a breast mass. They describe the characteristics of the cell nuclei present in the image.
Category: Healthcare
Rows: 569 Columns: 30
Available at OpenML: https://openml.org/d/1510
Multiclass classification
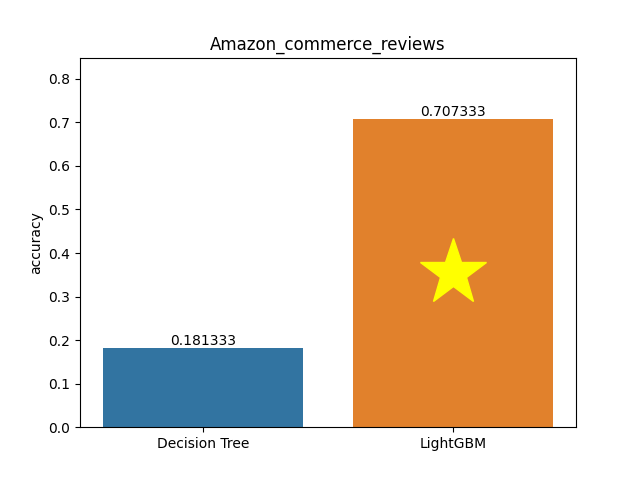
Amazon commerce reviews dataset
Metric: Accuracy
Decision Tree 0.18133 - vs - 0.70733 LightGBM
This is an amazon-commerce-reviews. Datasets are derived from the customer's reviews on Amazon Commerce Website for authorship identification. Most previous studies conducted identification experiments for two to ten authors. But in the online context, reviews to be identified usually have more potential authors, and normally classification algorithms are not adapted to a large number of target classes. To examine the robustness of classification algorithms, the authors of this database identify 50 of the most active users (represented by a unique ID and username) who frequently posted reviews in these newsgroups. The number of reviews we collected for each user is 30.
Category: Marketing
Rows: 1,500 Columns: 10,000
Available at OpenML: https://openml.org/d/1457
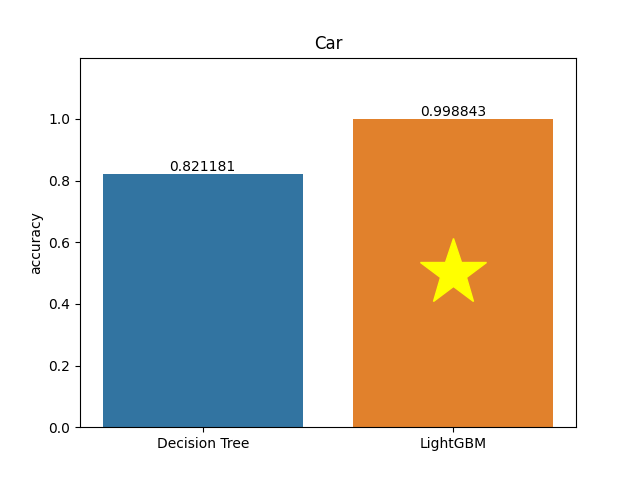
Car dataset
Metric: Accuracy
Decision Tree 0.82118 - vs - 0.99884 LightGBM
The Car Evaluation Database contains examples with the structural information removed, i.e., directly relates CAR to the six input attributes: buying, maint, doors, persons, lug_boot, safety. Because of known underlying concept structure, this database may be particularly useful for testing constructive induction and structure discovery methods.
Category: Automotive
Rows: 1,728 Columns: 6
Available at OpenML: https://openml.org/d/40975
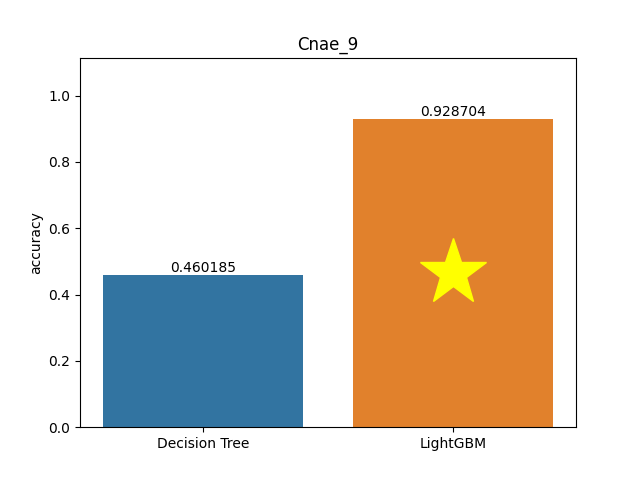
Cnae 9 dataset
Metric: Accuracy
Decision Tree 0.46019 - vs - 0.9287 LightGBM
This is a cnae-9 database. It is a data set containing 1080 documents of free text business descriptions of Brazilian companies categorized into a subset of 9 categories. The original texts were preprocessed to obtain the current data set: initially, it was kept only letters, and then was removed prepositions of the texts. Next, the words were transformed into their canonical form. Finally, each document was represented as a vector, where the weight of each word is its frequency in the document. This data set is highly sparse.
Category: Business
Rows: 1,080 Columns: 856
Available at OpenML: https://openml.org/d/1468
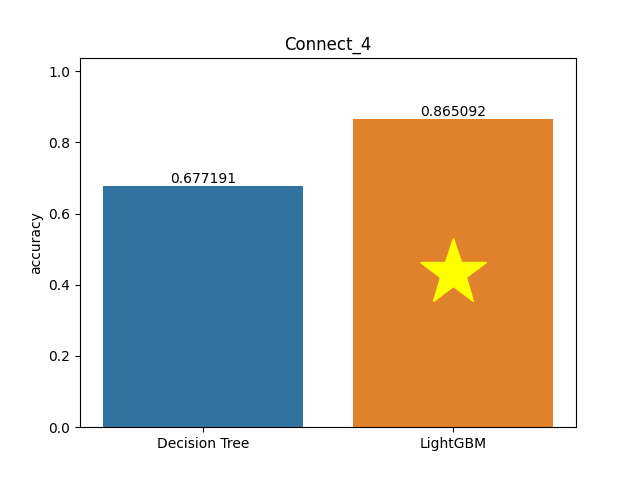
Connect 4 dataset
Metric: Accuracy
Decision Tree 0.67719 - vs - 0.86509 LightGBM
This database contains all legal 8-ply positions in the game of connect-4 in which neither player has won yet, and in which the next move is not forced. Attributes represent board positions on a 6x6 board. The outcome class is the game-theoretical value for the first player (2: win, 1: loss, 0: draw).
Category: Gaming
Rows: 45,312 Columns: 8
Available at OpenML: https://openml.org/d/40668
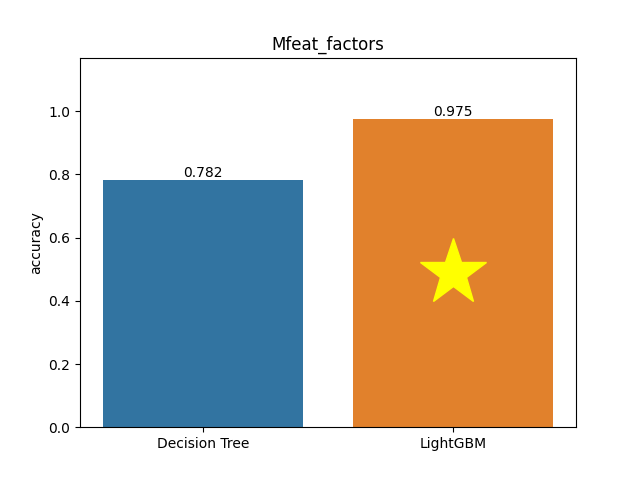
Mfeat factors dataset
Metric: Accuracy
Decision Tree 0.782 - vs - 0.975 LightGBM
One of a set of 6 datasets describing features of handwritten numerals (0 - 9) extracted from a collection of Dutch utility maps. Corresponding patterns in different datasets correspond to the same original character. 200 instances per class (for a total of 2,000 instances) have been digitized in binary images.
Category: Technology
Rows: 2,000 Columns: 216
Available at OpenML: https://openml.org/d/12

Segment dataset
Metric: Accuracy
Decision Tree 0.89957 - vs - 0.98268 LightGBM
The instances were drawn randomly from a database of 7 outdoor images. The images were hand-segmented to create a classification for every pixel. Each instance is a 3x3 region.
Category: Technology
Rows: 2,310 Columns: 19
Available at OpenML: https://openml.org/d/40984
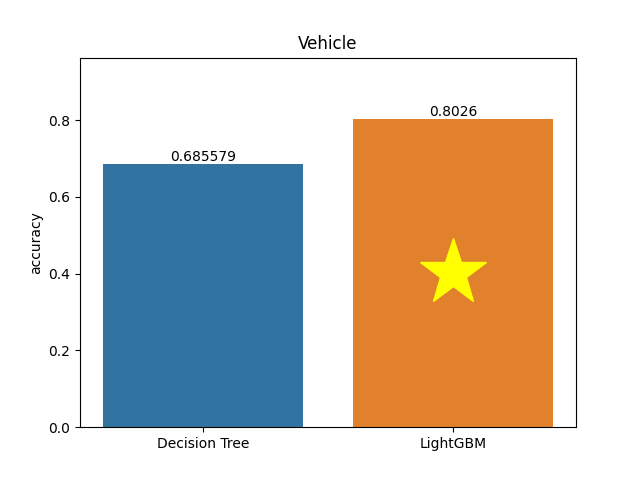
Vehicle dataset
Metric: Accuracy
Decision Tree 0.68558 - vs - 0.8026 LightGBM
The vehicle silhouettes - purpose to classify a given silhouette as one of four types of vehicle, using a set of features extracted from the silhouette. The vehicle may be viewed from one of many different angles.
Category: Automotive
Rows: 846 Columns: 18
Available at OpenML: https://openml.org/d/54
Regression
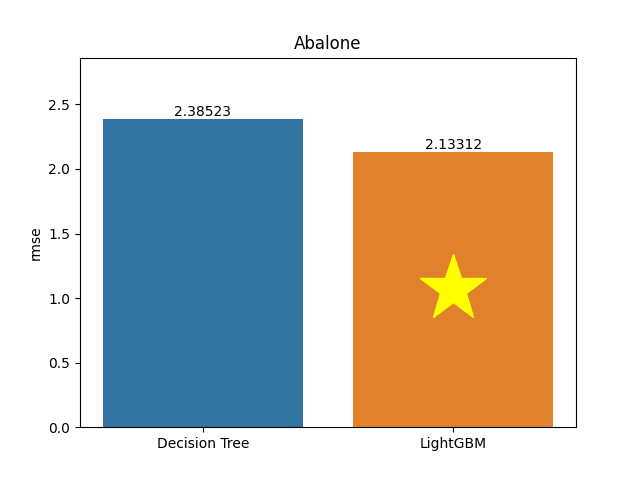
Abalone dataset
Metric: Root Mean Square Error (RMSE)
Decision Tree 2.38523 - vs - 2.13312 LightGBM
This is Abalone data. Predicting the age of abalone from physical measurements. The age of abalone is determined by cutting the shell through the cone, staining it, and counting the number of rings through a microscope. There are other, easier to obtain measurements to predict the age. Further information can be used, such as weather patterns and location (hence food availability).
Category: Animals
Rows: 4,177 Columns: 8
Available at OpenML: https://openml.org/d/42726
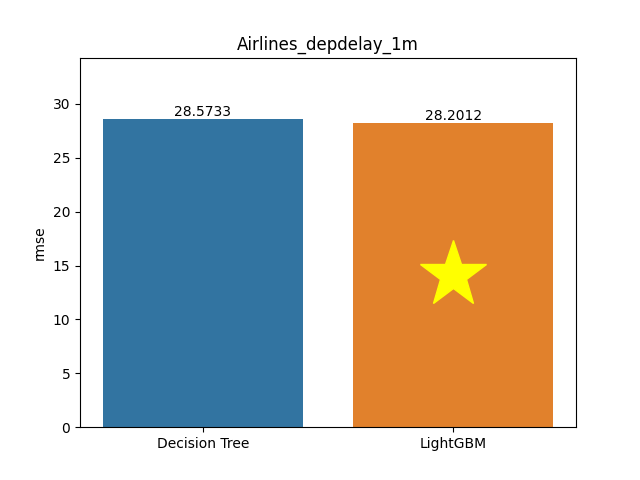
Airlines depdelay 1m dataset
Metric: Root Mean Square Error (RMSE)
Decision Tree 28.57332 - vs - 28.20115 LightGBM
This is an Airlines Departure Delay Prediction. This is a processed version of the original data, designed to predict departure delay.
Category: Insurance
Rows: 188,318 Columns: 131
Available at OpenML: https://openml.org/d/42721
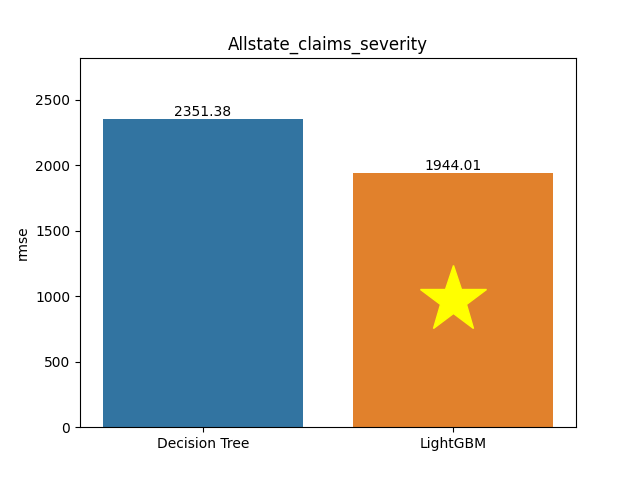
Allstate claims severity dataset
Metric: Root Mean Square Error (RMSE)
Decision Tree 2,351.3827 - vs - 1,944.00646 LightGBM
This is an Allstate Claims severity database. This dataset contains insurance claims. Allstate is developing automated methods of predicting the cost, and hence severity, of claims. This dataset was shared on Kaggle to find insight into better ways to predict claims severity.
Category: Energy
Rows: 45,312 Columns: 8
Available at OpenML: https://openml.org/d/42571
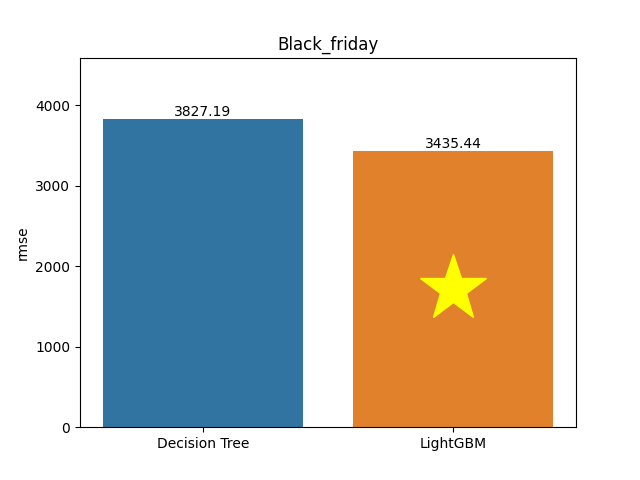
Black friday dataset
Metric: Root Mean Square Error (RMSE)
Decision Tree 3,827.18773 - vs - 3,435.44389 LightGBM
This is a Black Friday database. It contains customer purchases on Black Friday and information as age, gender, marital status of consumers.
Category: Retail
Rows: 166,821 Columns: 9
Available at OpenML: https://openml.org/d/41540
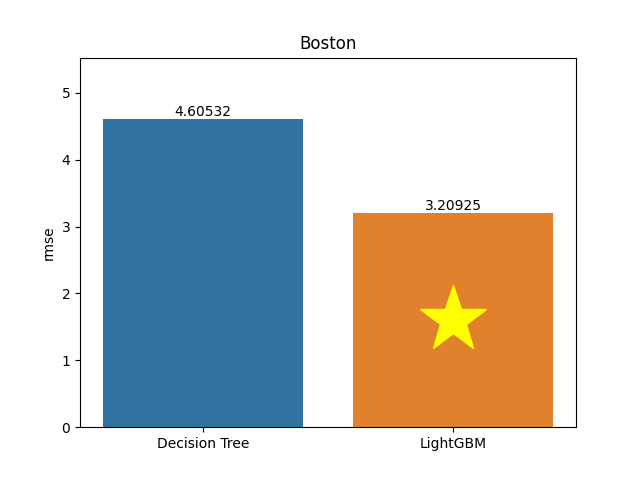
Boston dataset
Metric: Root Mean Square Error (RMSE)
Decision Tree 4.60532 - vs - 3.20925 LightGBM
This is the Boston house-price data database. It contains such information as per capita crime rate by town, the proportion of non-retail business acres per town, the average number of rooms per dwelling.
Category: Real Estate
Rows: 506 Columns: 13
Available at OpenML: https://openml.org/d/531
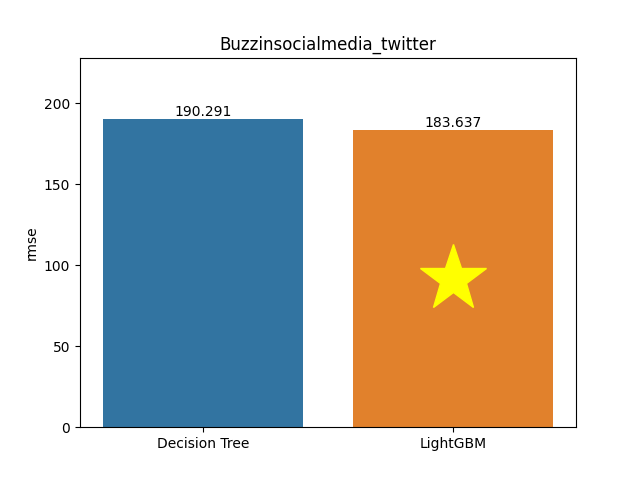
Buzzinsocialmedia twitter dataset
Metric: Root Mean Square Error (RMSE)
Decision Tree 190.29065 - vs - 183.63726 LightGBM
This is a Buzz in the Social Media Twitter database. This data-set contains examples of buzz events from two different social networks: Twitter, and Tom's Hardware, a forum network focusing on new technology with more conservative dynamics.
Category: Social Media
Rows: 583,250 Columns: 77
Available at OpenML: https://openml.org/d/4549

Colleges dataset
Metric: Root Mean Square Error (RMSE)
Decision Tree 0.17301 - vs - 0.14296 LightGBM
This is the Colleges database. Regroups information for about 7800 different US colleges. Including geographical information, stats about the population attending, and post-graduation career earnings.
Category: People
Rows: 7,063 Columns: 47
Available at OpenML: https://openml.org/d/42727
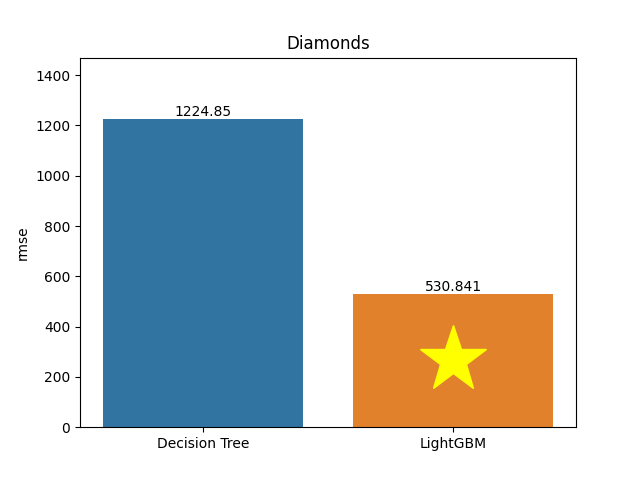
Diamonds dataset
Metric: Root Mean Square Error (RMSE)
Decision Tree 1,224.84584 - vs - 530.84138 LightGBM
This is a Diamonds database. This classic dataset contains the prices and other attributes of almost 54,000 diamonds.
Category: Technology
Rows: 53,940 Columns: 9
Available at OpenML: https://openml.org/d/42225
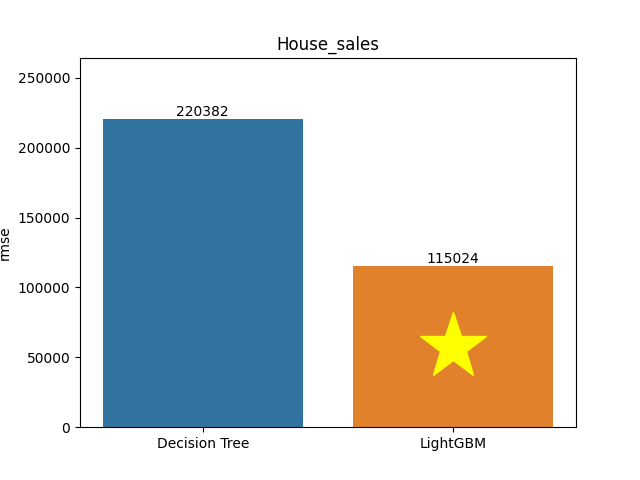
House sales dataset
Metric: Root Mean Square Error (RMSE)
Decision Tree 220,382.0876 - vs - 115,024.1367 LightGBM
This is a house_sales database. This dataset contains house sale prices for King County, which includes Seattle. It includes homes sold between May 2014 and May 2015. It contains 19 house features plus the price and the id columns, along with 21613 observations. It's a great dataset for evaluating simple regression models.
Category: Business
Rows: 21,613 Columns: 22
Available at OpenML: https://openml.org/d/42731
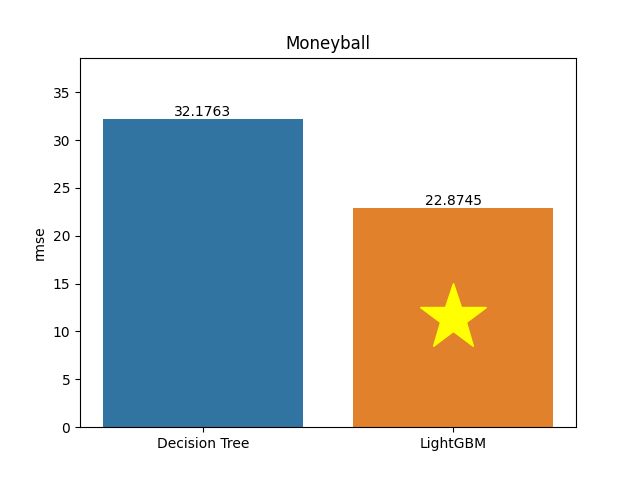
Moneyball dataset
Metric: Root Mean Square Error (RMSE)
Decision Tree 32.17626 - vs - 22.87451 LightGBM
This is the Moneyball database. This dataset contains some of the information that was available to Billy Beane and Paul DePodesta, who worked for the Oakland Athletics in the early 2000s and changed the game of baseball. It can be used to understand their statistical methods better. The database contains such information as team, league, year, runs scored, wins.
Category: Sport
Rows: 1,232 Columns: 14
Available at OpenML: https://openml.org/d/41021
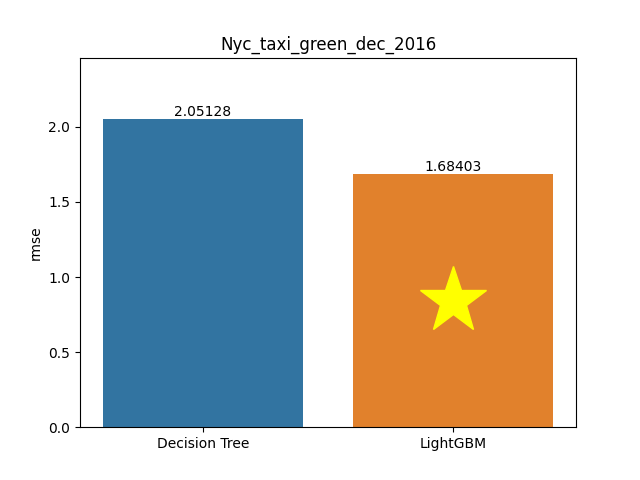
Nyc taxi green dec 2016 dataset
Metric: Root Mean Square Error (RMSE)
Decision Tree 2.05128 - vs - 1.68403 LightGBM
This is a Trip Record Data database. It is provided by the New York City Taxi and Limousine Commission (TLC). The dataset included TLC trips of the green line in December 2016.
Category: Automotive
Rows: 581,835 Columns: 18
Available at OpenML: https://openml.org/d/42729
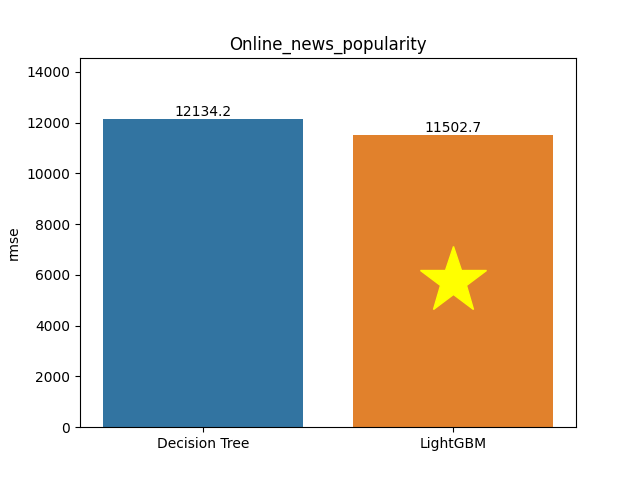
Online news popularity dataset
Metric: Root Mean Square Error (RMSE)
Decision Tree 12,134.23469 - vs - 11,502.71558 LightGBM
This is an Online News Popularity database. This dataset summarizes a heterogeneous set of features about Mashable articles in a period of two years. The goal is to predict the number of shares in social networks (popularity).
Category: Marketing
Rows: 39,644 Columns: 60
Available at OpenML: https://openml.org/d/42724
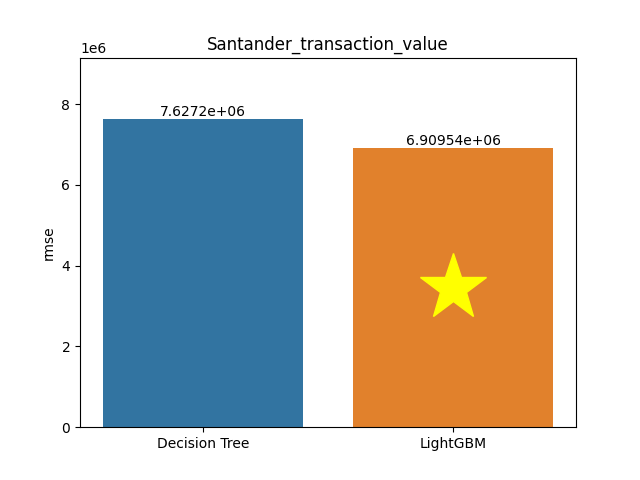
Santander transaction value dataset
Metric: Root Mean Square Error (RMSE)
Decision Tree 7,627,197.61501 - vs - 6,909,539.86478 LightGBM
This is a Santander Transaction Value database. It provides an anonymized dataset containing numeric feature variables, the numeric target column, and a string ID column. The Santander Group supplied this database on Kaggle to find a way to identify the value of transactions for each potential customer. This is the first step that Santander needs to nail in order to personalize their services at scale. The digitalization of everyday lives means that customers expect services to be delivered in a personalized and timely manner... and often before they've even realized they need the service.
Category: Technology
Rows: 4,459 Columns: 4,992
Available at OpenML: https://openml.org/d/42572
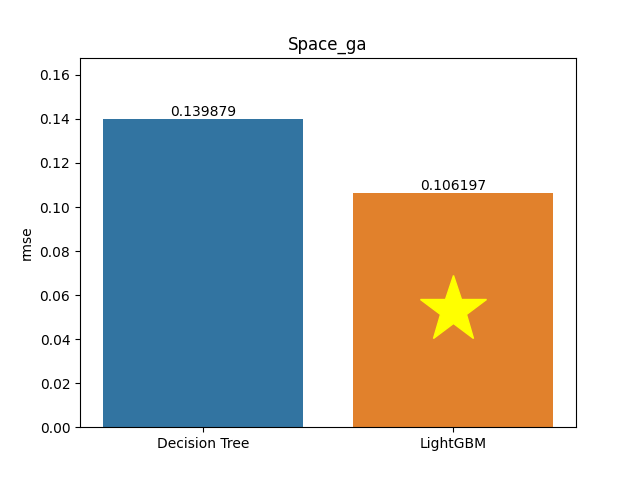
Space ga dataset
Metric: Root Mean Square Error (RMSE)
Decision Tree 0.13988 - vs - 0.1062 LightGBM
This is an Election database. It contains 3,107 observations on county votes cast in the 1980 U.S. presidential election. Specifically, it contains the total number of votes cast in the 1980 presidential election per county (VOTES), the population in each county of 18 years of age or older (POP), the population in each county with a 12th grade or higher education ( EDUCATION), the number of owner-occupied housing units (HOUSES), the aggregate income (INCOME), the X spatial coordinate of the county (XCOORD), and the Y spatial coordinate of the county (YCOORD).
Category: Public Sector
Rows: 3,107 Columns: 6
Available at OpenML: https://openml.org/d/507
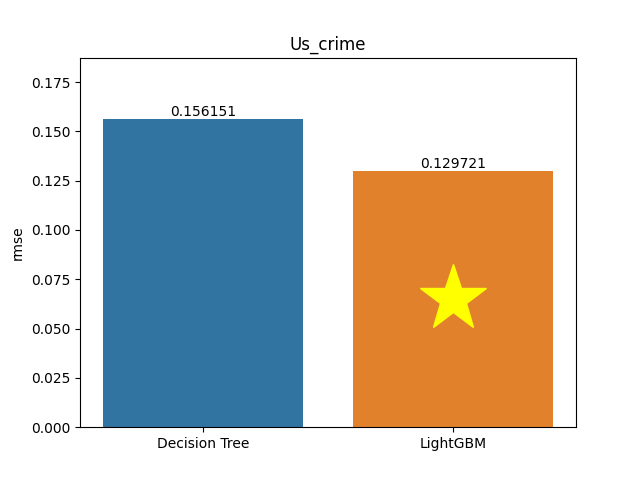
Us crime dataset
Metric: Root Mean Square Error (RMSE)
Decision Tree 0.15615 - vs - 0.12972 LightGBM
This is a Communities and Crime database. Communities within the United States. The data combines socio-economic data from the 1990 US Census, law enforcement data from the 1990 US LEMAS survey, and crime data from the 1995 FBI UCR.
Category: People
Rows: 1,994 Columns: 127
Available at OpenML: https://openml.org/d/42730
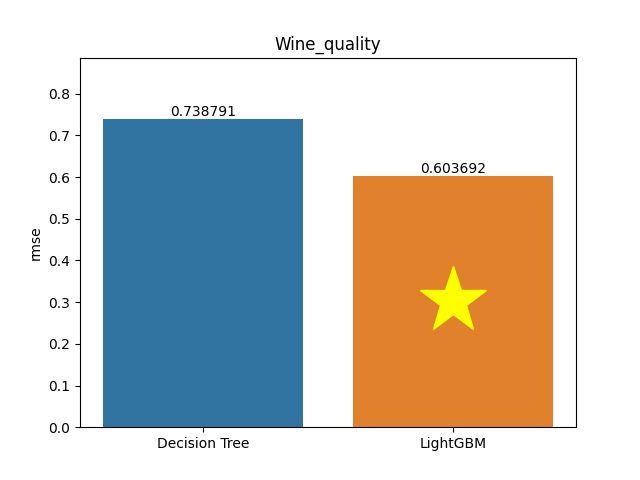
Wine quality dataset
Metric: Root Mean Square Error (RMSE)
Decision Tree 0.73879 - vs - 0.60369 LightGBM
This is a Wine Quality database. Datasets are related to red and white variants of the Portuguese 'Vinho Verde' wine. Due to privacy and logistic issues, only physicochemical (inputs) and sensory (the output) variables are available (e.g., there is no data about grape types, wine brand, wine selling price, etc.). The inputs include objective tests (e.g., PH values), and the output is based on sensory data (median of at least 3 evaluations made by wine experts). Each expert graded the wine quality between 0 (very bad) and 10 (very excellent).
Category: Retail
Rows: 6,497 Columns: 11
Available at OpenML: https://openml.org/d/287