Is weather correlated with cryptocurrency price?
Recently I was messing around with some data analysis, and came up with a fun use case that maybe can interest you in data science too. As you probably read in the title, I will show you how to calculate the correlation between hourly temperature in major cities and Bitcoin price. In my opinion it is an honestly intriguing intro into data science.
Table of contents
Requirements
To perform our calculation, we will need some data, namely:
- Hourly temperature records,
- Hourly Bitcoin price,
Also, we will need a way to process this data in the program.
Used tools
By snooping on the Internet I found some free APIs that provide the data we require in formats we require.
For weather, I used weatherapi.com, which has a free tier including last 7 days of historical data, with hourly steps, perfect for our use case.
To get Bitcoin price api.binance.com, came in useful, similarly to the weather, we can get data with hourly intervals on a given date.
To help with data analysis I chose MLJAR studio, because this editor provides a way to simply make HTTP request, and many other code recipes simple enough for a beginner data scientist like me.
The solution
1. Get the data
First, let's get the weather, the endpoint we are looking for is: https://api.weatherapi.com/v1/history.json with the parameters:
qfor location, for the first request, let's choose Londondtfor date time in the format ofYYYY-MM-DD, I chose 2024-09-23keywith a secret API key that you get when you create your account, remember to configure the API to avoid potential unnecessary fees
The return content is in JSON, which will make it easy to work with.
Now it's time for the Bitcoin price, the endpoint used was: https://api.binance.com/api/v3/klines, and parameter a passed in was:
startTimein Unix format with milliseconds, for conversion from human-readable date I used this websiteendTimeI always started at 00:00 and finished at 23:50 (11:50 pm)symbolwas equal toBTCUSDTfor Bitcoin price inUSDintervalset to1h
2. Format the data
In this step we will strip our data from all the additional info around it and only leave to most important and correctly labeled numbers.
First, let's turn our API responses into pandas Data Frames like so:
weatherDF = pd.DataFrame(weatherResponse)
bitcoinDF = pd.DataFrame(bitcoinResponse)
The weather response returns a lot of info like: longitude or local time zone, to be frank, we don't need those, so to strip them out, we will do something like this:
weatherDF = weatherDF["forecast"]["forecastday"][0]["hour"]
Rename some columns for more clarity
weatherDF = weatherDF.rename(columns={"time_epoch": "Hour"})
bitcoinDF = bitcoinDF.rename(columns={2: "High price", 3: "Low price", 11: "Hour"})
For the weather, I overwrote the time_epoch column with the value of the time column converted to a single number representing the hour.
weatherDF["Hour"] = pd.to_datetime(weatherDF["time"]).dt.hour
In the Bitcoin data frame, we change some of the column's data types to numeric for easier handling and filling out the Hour columns with apropriate values
bitcoinDF["High price"] = pd.to_numeric(bitcoinDF["High price"])
bitcoinDF["Low price"] = pd.to_numeric(bitcoinDF["Low price"])
bitcoinDF["Hour"] = pd.to_numeric(bitcoinDF["Hour"])

for i in range(24):
    bitcoinDF.loc[i, ("Hour")] = i
After all the cutting, striping, and formatting, our data should look something like this.
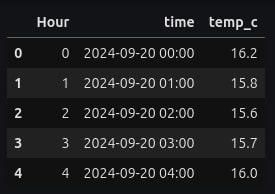
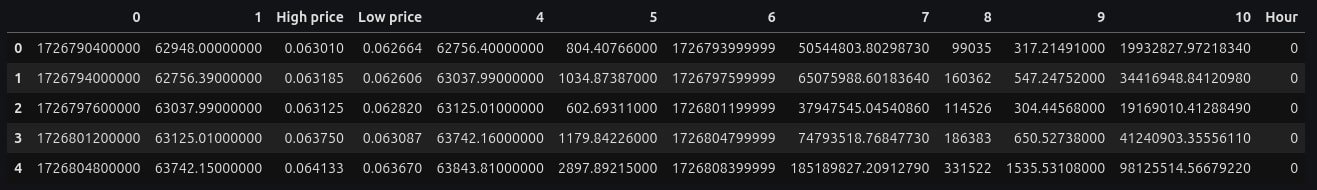 Those are the heads of weather and Bitcoin data frames
3. Calculate the correlation
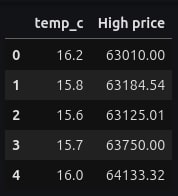
To ease our calculations I'll create another data frame, with only two values, temperature and Bitcoin price.
combineDF = pd.DataFrame(
    data=(weatherDF["temp_c"], bitcoinDF["High price"]),
)
combineDF = combineDF.transpose()
combineDF head should look something like this:
Geting a correlation form data frame structured like this is trivialy easy, because pandas provides us with a .corr() method, let's use it!
combineDF.corr()
And the result is:
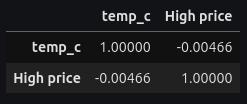
We can see that the correlation is equal to -0.0046, which means there is 0.4% correlation between temperature in London and Bitcoin price on 23 September 2024
Get more examples
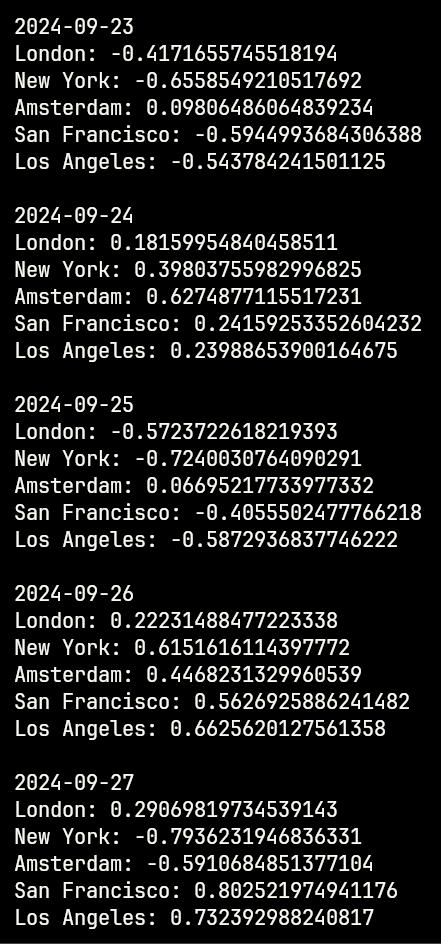
By repeating this formula, we can easily calculate the correlation for more cities on more dates. So, I went ahead and did so. There are the correlations for London, New York, Amsterdam, Los Angeles, and San Francisco in the last week (23-27 Sep 2024)
Conclusion
As I hope you've seen data science isn't scary and can be pretty fun too. Would I say that making your financial decisions based on last week weather data is responsible and will return any profit? No, but it's a good example to sharpen your skills that might prove useful in your next job interview and life in general.
Explore next
Continue with practical guides, tutorials, and product workflows for Python, AutoML, and local AI data analysis.
- AI Data Analyst
Analyze local data with conversational AI support and notebook-based, reproducible Python workflows.
- AutoLab Experiments
Run autonomous ML experiments, track iterations, and inspect results in transparent notebook outputs.
- MLJAR AutoML
Learn how to train, compare, and explain tabular machine learning models with open-source automation.
- Machine learning tutorials
Step-by-step guides for beginners and practitioners working with Python, AutoML, and data workflows.
Run AI for Machine Learning — Fully Local
MLJAR Studio is a private AI Python notebook for data analysis and machine learning. Generate code with AI, run experiments locally, and keep full control over your workflow.
Related Articles
- Machine Learning Algorithm Comparison
- TabNet vs XGBoost
- 4 Effective Ways to Visualize LightGBM Trees
- 4 Effective Ways to Visualize Random Forest
- 4 Effective Ways to Visualize XGBoost Trees
- How to become a Data Scientist?
- 6 best packages for data visualization in Python
- How to install packages in Python
- The future of no code data science
- Programming Languages for Data Science