Build dashboard in Python with automatic updates and email notifications
 Do you need to monitor data from multiple sources and act based on their values? If you answered yes, then it means that you need a dashboard. I will show you how to create a dashboard in Python. It will automatically update the values in the dashboard and send email notifications based on monitored values. The dashboard will be deployed to the Amazon AWS cloud service.
The dashboard will be created in Python with Jupyter Notebook. It will monitor data from multiple sources:
- stock exchange (data from Yahoo finance),
- cryptocurrency exchange (data from Binance REST API),
- weather (data from open-meteo.com).
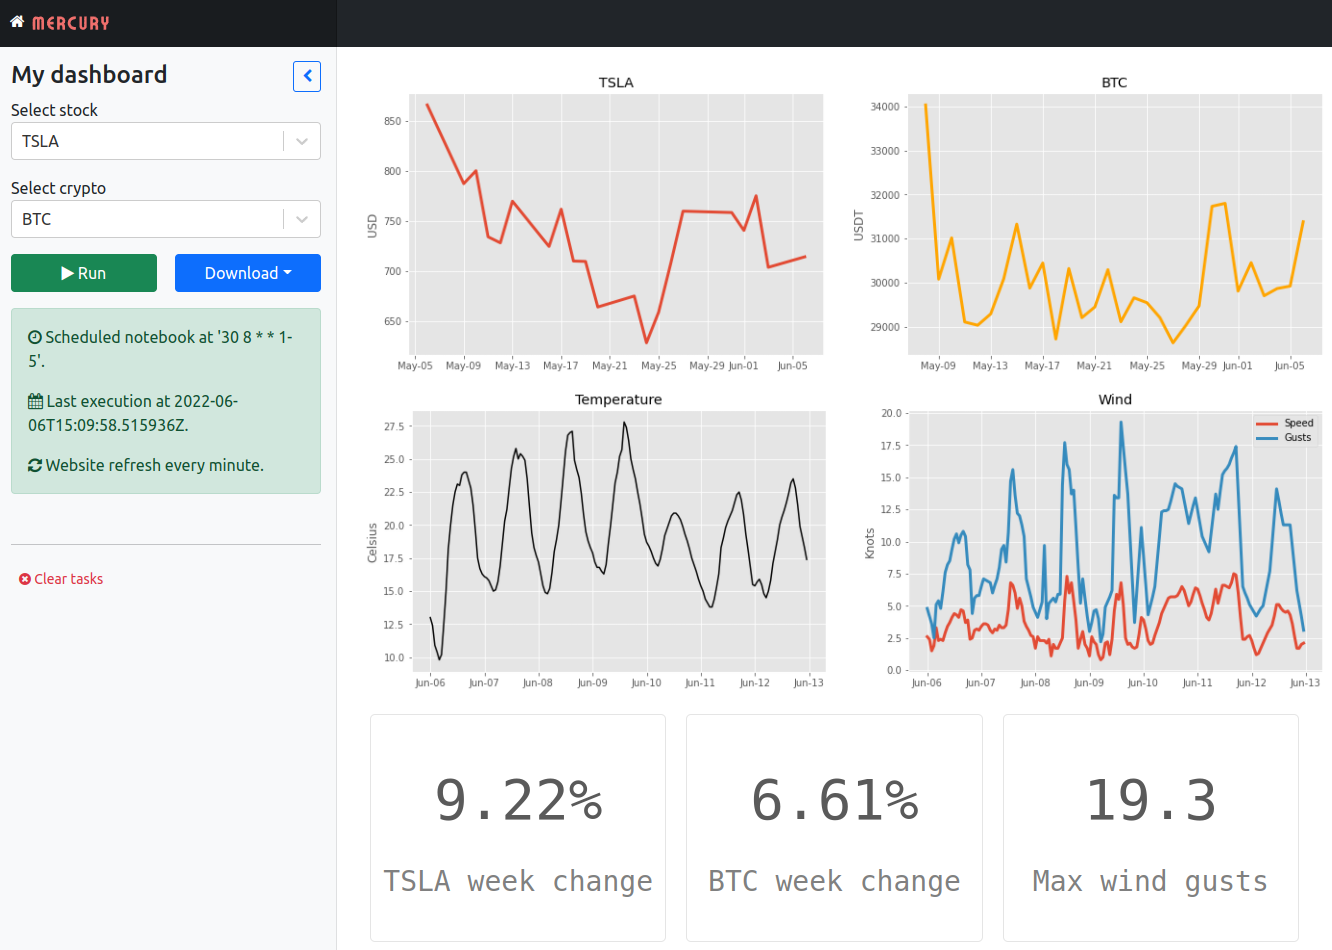
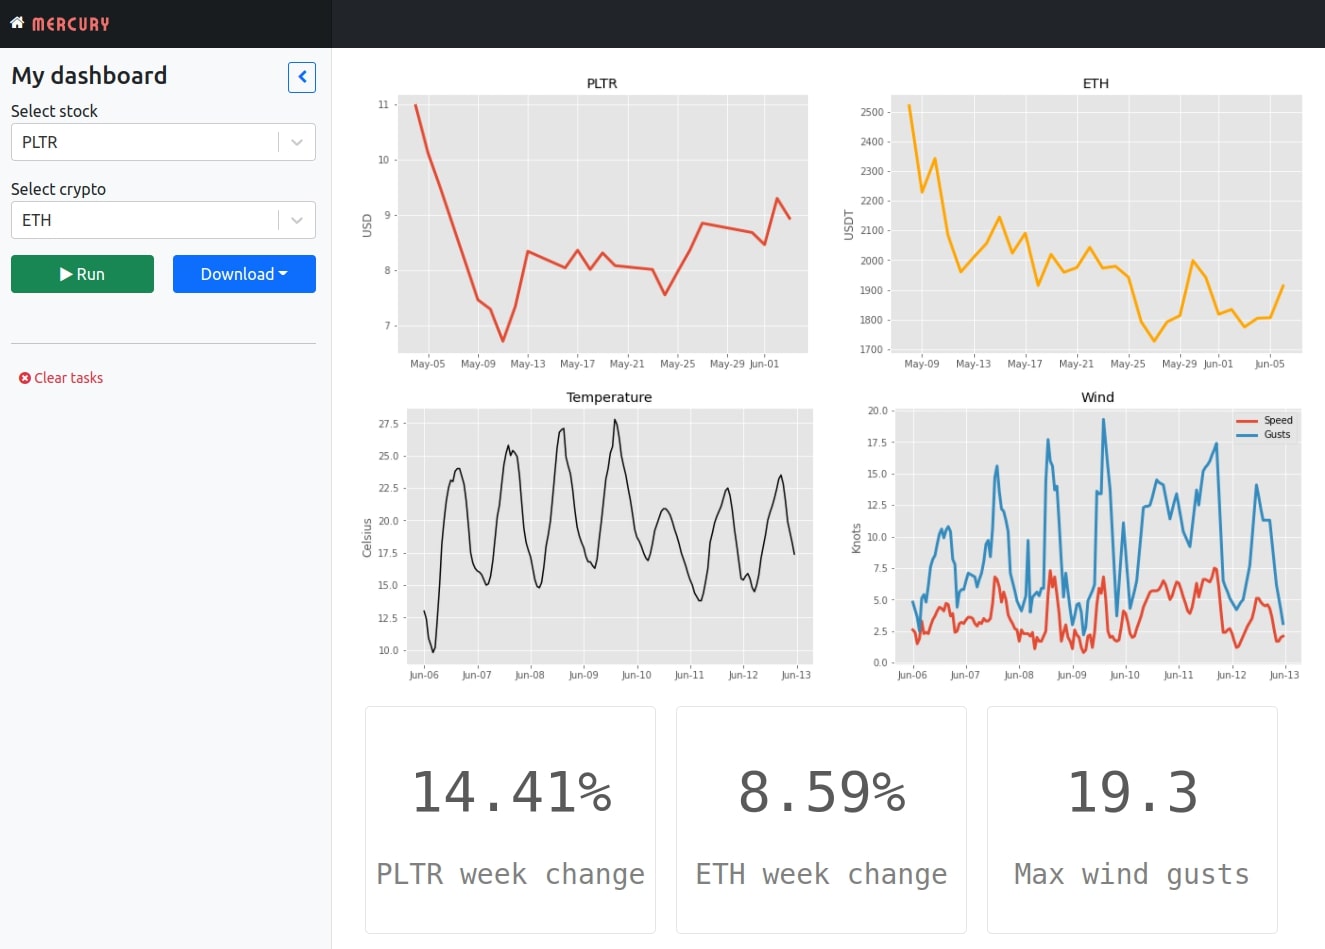
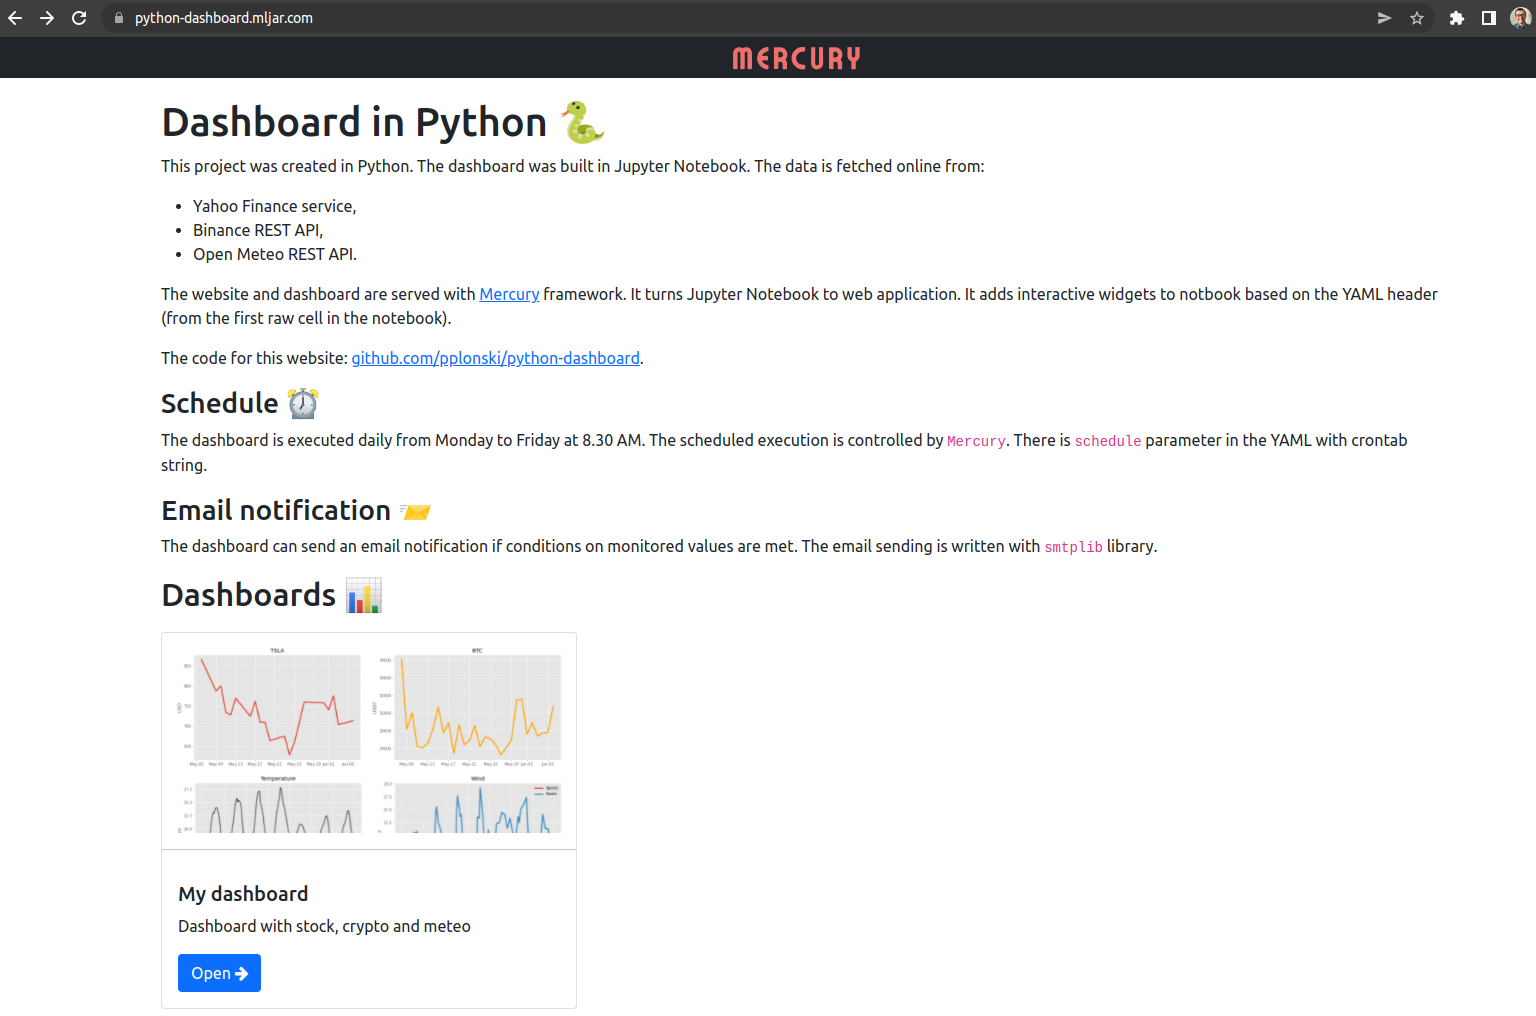
The data will be displayed on charts and value boxes. The data will be updated daily. The dashboard will be served with an open-source Mercury framework. It converts Jupyter Notebook into a web application and schedules notebook execution. The web application will be deployed to AWS EC2 with docker-compose. The screenshot of the dashboard:
Environment setup
The first step is to set up the environment for development. The project's code will be in the GitHub repository. The link to the repo: github.com/pplonski/python-dashboard - keeping code in the repository will be a handful for deployment. Let's clone the empty repo to the local machine:
git clone git@github.com:pplonski/python-dashboard.git
I will use the virtualenv to create a virtual environment for my project:
virtualenv pdenv --python=python3.8
The name of the virtual environment is pdenv. Let's define all needed packages in the requirements.txt file:
mljar-mercury
python_dotenv
yfinance
matplotlib
numpy
pandas
requests
bloxs
Install them after environment activation:
# activate the env
source pdenv/bin/activate
# install all packages
pip install -r requirements.txt
The important step is to add our virtual environment as a kernel in the Jupyter Notebook:
python -m ipykernel install --user --name=pdenv
After executing the above command, the pdenv will be available as a kernel in the Jupyter Notebook.
Data Sources
All data will be fetched during notebook execution. Please start the Jupyter Notebook:
jupyter notebook
Please create a new notebook with the pdenv kernel. My notebook is named dashboard.ipynb.
The stock data will be loaded with the yfinance package. It uses the Yahoo Finance REST API to get information about stock data. The stock loading code:
import yfinance as yf

stock_symbol = "MSFT" # MSFT is Microsoft symbol on stock exchange

stock  = yf.Ticket(stock_symbol)
stock_hist = stock.history()
The stock_hist is a DataFrame with 30 days of stock history with 1-day interval.
To get the data about cryptocurrency, we will use the Binance REST API and requests package:
import requests

crypto_symbol = "BTC" # Bitcoin

# get crypto data from Binance REST API
def get_crypto_data(symbol):
    try:
        response = requests.get(f"https://www.binance.com/api/v1/klines?symbol={symbol}&interval=1d&limit=30")
        candles = response.json()
        df = pd.DataFrame(candles, columns=["Open time", "Open", "High", "Low", "Close", "Volume",
                                        "Close time", "Quote", "Trades", "BaseVol", "QuoteVol", "Igonre"])
        df["Date"] = pd.to_datetime(df["Open time"], unit='ms')
        for col in ["Open", "High", "Low", "Close", "Volume"]:
            df[col] = df[col].astype(float)
        df = df.set_index('Date')
        return df
    except Exception as e:
        print(str(e))
        return None

crypto = get_crypto_data(f"{crypto_symbol}USDT")
The crypto variable keeps the information about BTC to USDT 30 days price history with 1 day interval.
For the weather data, I will use open-meteo.com. The service is free to use and has an amazing link builder interface in the documentation. To get weather, we need to pass latitude and longitude. You can get them from Google Maps.
# get weather data from open meteo REST API
def get_meteo_data(lat = 52.9314055, lon=23.7737443):
    try:
        url = f"https://api.open-meteo.com/v1/forecast?latitude={lat}&longitude={lon}&hourly=temperature_2m,windspeed_10m,windgusts_10m&windspeed_unit=kn&timezone=Europe%2FBerlin"
        data = requests.get(url).json()
        meteo = pd.DataFrame(data["hourly"])
        meteo.time = pd.to_datetime(meteo.time)
        return meteo
    except Exception as e:
        print(str(e))
        return None

meteo = get_meteo_data()
The meteo is a DataFrame with hourly information about the weather for the next 7 days. It has information about temperature and wind speed. My kids are training sailing, so the wind speed is important for us ;)
We have the data in 3 DataFrames. The data is fetched from the internet resources during the notebook execution.
Plot data
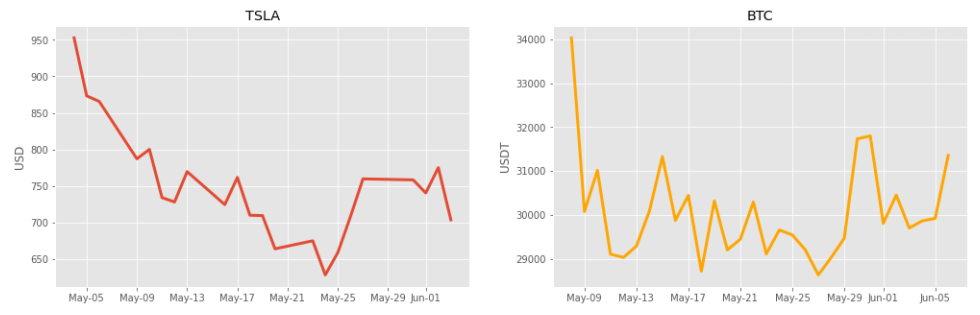
There will be 4 charts in the dashboard. The first two charts will be with financial data:
- chart with stock price for the last 30 days,
- chart with crypto price for the last 30 days.
# import packages
from matplotlib import dates as mdates
from matplotlib import pyplot as plt
plt.style.use('ggplot')


# plot finance charts
fig, ax = plt.subplots(1, 2, figsize=(17,5))

_ = ax[0].plot(stock_hist.Close,  linewidth=3)
ax[0].xaxis.set_major_formatter(mdates.DateFormatter('%b-%d'))
_=ax[0].set_ylabel("USD")
ax[0].title.set_text(stock_symbol)

_=ax[1].plot(crypto.Close, color="orange", linewidth=3)
ax[1].title.set_text(crypto_symbol)
ax[1].xaxis.set_major_formatter(mdates.DateFormatter('%b-%d'))
_=ax[1].set_ylabel("USDT")
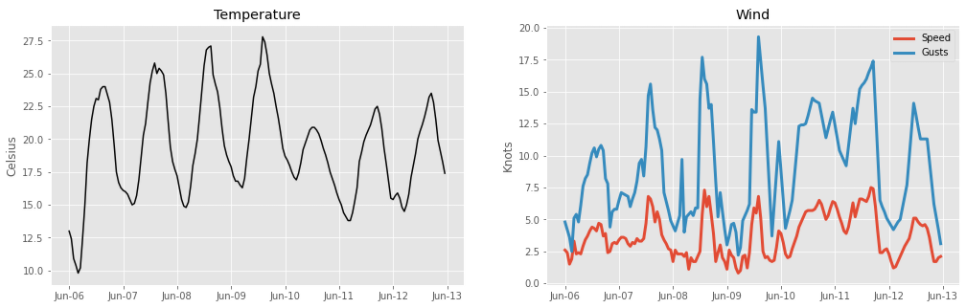
Plot weather charts:
- one chart with temperature for the next 7 days,
- wind speed for the next 7 days.
# plot meteo charts
fig, ax = plt.subplots(1, 2, figsize=(17,5))

_=ax[0].plot(meteo.time, meteo.temperature_2m, color="black")
ax[0].xaxis.set_major_formatter(mdates.DateFormatter('%b-%d'))
ax[0].set_ylabel("Celsius")
ax[0].title.set_text("Temperature")

_=ax[1].plot(meteo.time, meteo.windspeed_10m, label="Speed", linewidth=3)
_=ax[1].plot(meteo.time, meteo.windgusts_10m, label="Gusts", linewidth=3)
_=ax[1].title.set_text("Wind")
_=ax[1].set_ylabel("Knots")
ax[1].xaxis.set_major_formatter(mdates.DateFormatter('%b-%d'))
_=ax[1].legend()
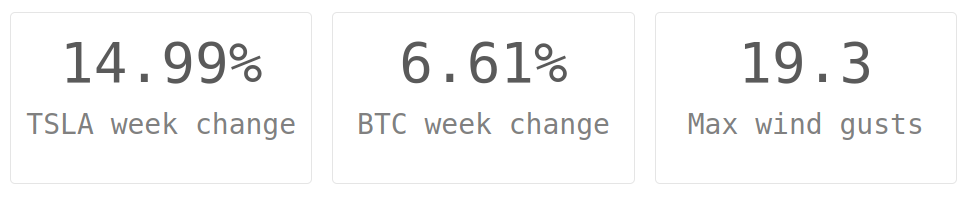
Boxes with values
I will compute some additional values that will be displayed in value boxes. I will use the Bloxs package to display values in boxes. I will display current prices, max temperature, and max wind gusts for the next 7 days.
Let's compute the maximum price change during the last 7 days:
# week max change for stock
stock_change = (stock_hist.tail(7).Close.max() - stock_hist.tail(7).Close.min())/stock_hist.tail(7).Close.max()

# week max change for crypto
crypto_change = (crypto.tail(7).Close.max() - crypto.tail(7).Close.min())/crypto.tail(7).Close.max()
I will display data with the Bloxs package:
# remember to import needed packages
from bloxs import B

# display boxes
B([
    B(f"{np.round(stock_change*100, 2)}%", f"{stock_symbol} week change"),
    B(f"{np.round(crypto_change*100, 2)}%", f"{crypto_symbol} week change"),
    B(meteo.windgusts_10m.max(), f"Max wind gusts"),
])
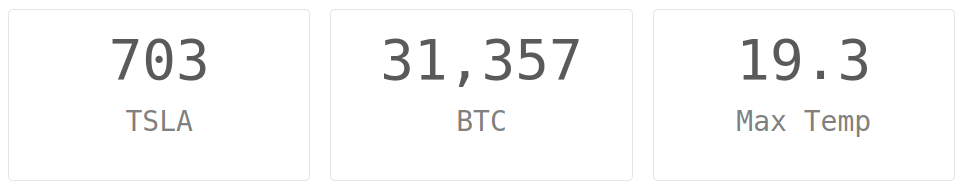
The next rows of 'Bloxs':
B([
    B(stock_hist.Close[-1].astype(int), f"{stock_symbol}"),
    B(crypto.Close[-1].astype(int), f"{crypto_symbol}"),
    B(meteo.windgusts_10m.max(), f"Max Temp"),
])
Email notifications
We have current data values. Let's define alerts with email notifications. I will use smtplib and email packages. I've constructed a very simple EmailService class. It loads email address and password from environment variables.
I'm using my Gmail account to send an email. The password is the app password generated to use in the code (the docs how to generate an app password for Gmail account). The email address and password can't be hardcoded in the code! I'm using python-dotenv to load environment variables from .env file. The .env shouldn't be committed to the GitHub repository.
import smtplib
from email.message import EmailMessage
from dotenv import load_dotenv

_ = load_dotenv()


class EmailService:
    def __init__(self):
        self.address = os.environ.get("EMAIL_ADDRESS")
        self.password = os.environ.get("EMAIL_PASSWORD")

    def send(self, to_address, subject, message):
        msg = EmailMessage()
        msg['Subject'] = subject
        msg['From'] = self.address
        msg['To'] = to_address
        msg.set_content(message)

        with smtplib.SMTP_SSL('smtp.gmail.com', 465) as smtp:
            smtp.login(self.address, self.password)
            smtp.send_message(msg)
Setting the alert for wind max speed. If the maximum wind gusts are larger than 25 knots, let's send an email notification:
if meteo.windgusts_10m.max() > 25:
    EmailService().send("piotr@mljar.com",
        "Strong wind gusts alert",
        f"There might be strong wind gusts in the next 7 days. Up to {meteo.windgusts_10m.max()} knots.")
Email notifications for financial changes:
if stock_change > 0.3: # stock change over 30% send email notification
    EmailService().send("piotr@mljar.com",
        "Stock large price change alert",
        f"Large price change ({np.round(stock_change*100.0,2)}%) of {stock_symbol} in the last 7 days.")


if crypto_change > 0.3: # crypto change over 30% send email notification
    EmailService().send("piotr@mljar.com",
        "Crypto price large change alert",
        f"Large price change ({np.round(crypto_change*100.0,2)}%) of {crypto_symbol} in the last 7 days.")
Turn notebook to web application
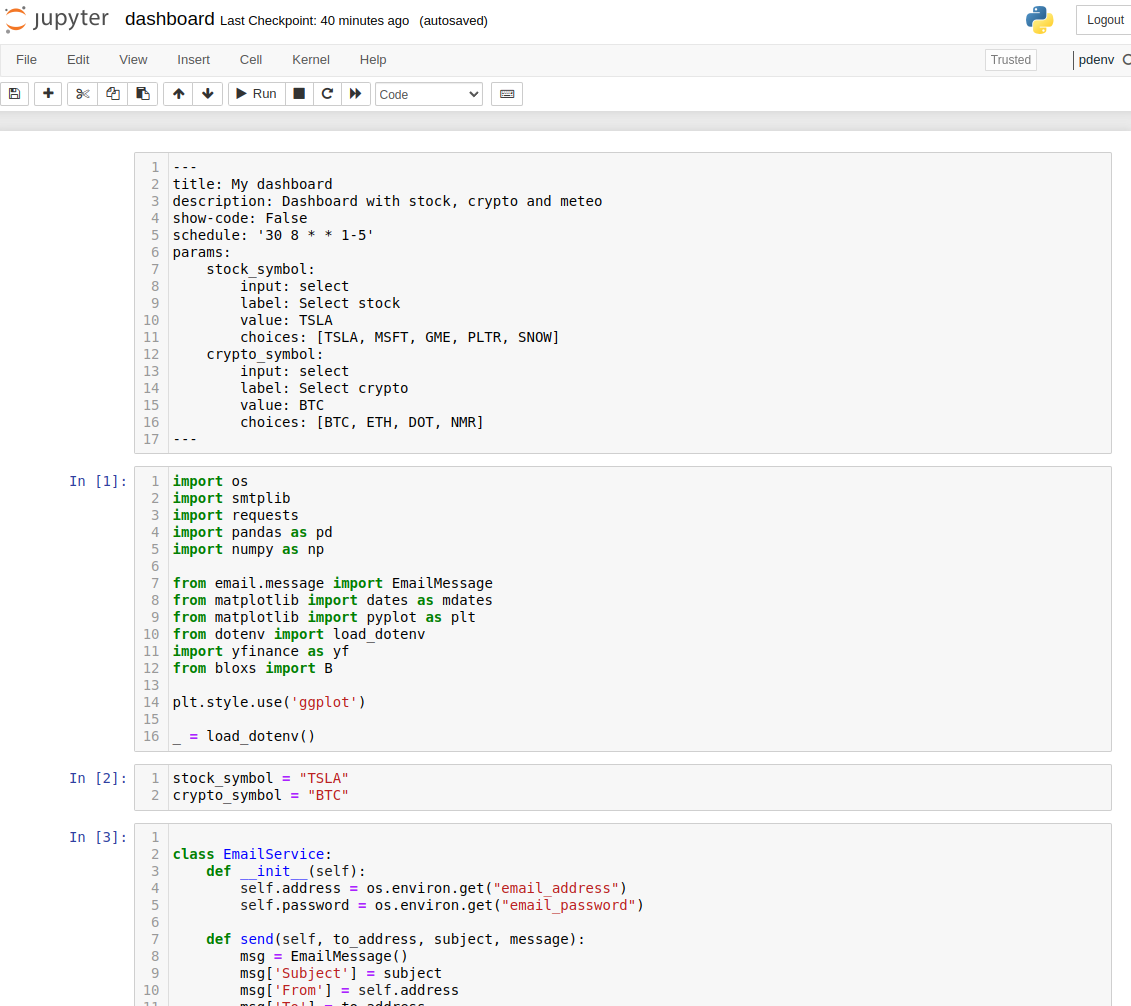
The notebook can be turned into a web application with Mercury framework. It requires a YAML header in the first raw cell in the notebook. The header defines title and description. The code can be easily hidden with show-code: False. Additionally, the interactive widgets can be added to the notebook. In the below YAML header the two widgets are added stock_symbol and crypto_symbol. The widgets are directly connected to variables in the Python code.
The YAML header:
---
title: My dashboard
description: Dashboard with stock, crypto and meteo
show-code: False
params:
    stock_symbol:
        input: select
        label: Select stock
        value: TSLA
        choices: [TSLA, MSFT, GME, PLTR, SNOW]
    crypto_symbol:
        input: select
        label: Select crypto
        value: BTC
        choices: [BTC, ETH, DOT, NMR]
---
The variables that are controlled by Mercury widgets should be in a separate cell:
stock_symbol = "TSLA"
crypto_symbol = "BTC"
To see the notebook as a web application, you need to run the Mercury server. Please use the command:
mercury run
It will load your Python notebook and serve locally at 127.0.0.1. You can open the web browser and see the dashboard running:
You can change the widget values and execute the notebook with new values.
Schedule notebook
The notebook can be easily executed in the schedule with the Mercury framework. You just need to add schedule parameter in the YAML with crontab string. I will set the execution for every day between Monday and Friday at 8.30 in the morning. The additional parameter is schedule: '30 8 * * 1-5', and the full YAML in the notebook is presented in the picture below:
Deployment
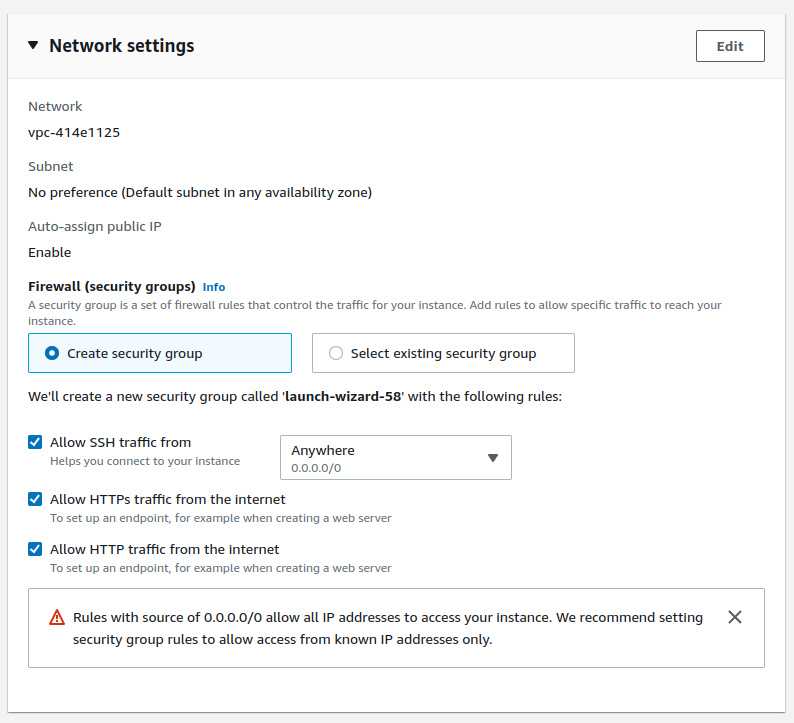
I will deploy the dashboard created in Python to the AWS EC2 machine. I will use t3a.small machine with 2 vCPU and 2 GB of RAM and Ubuntu operating system:
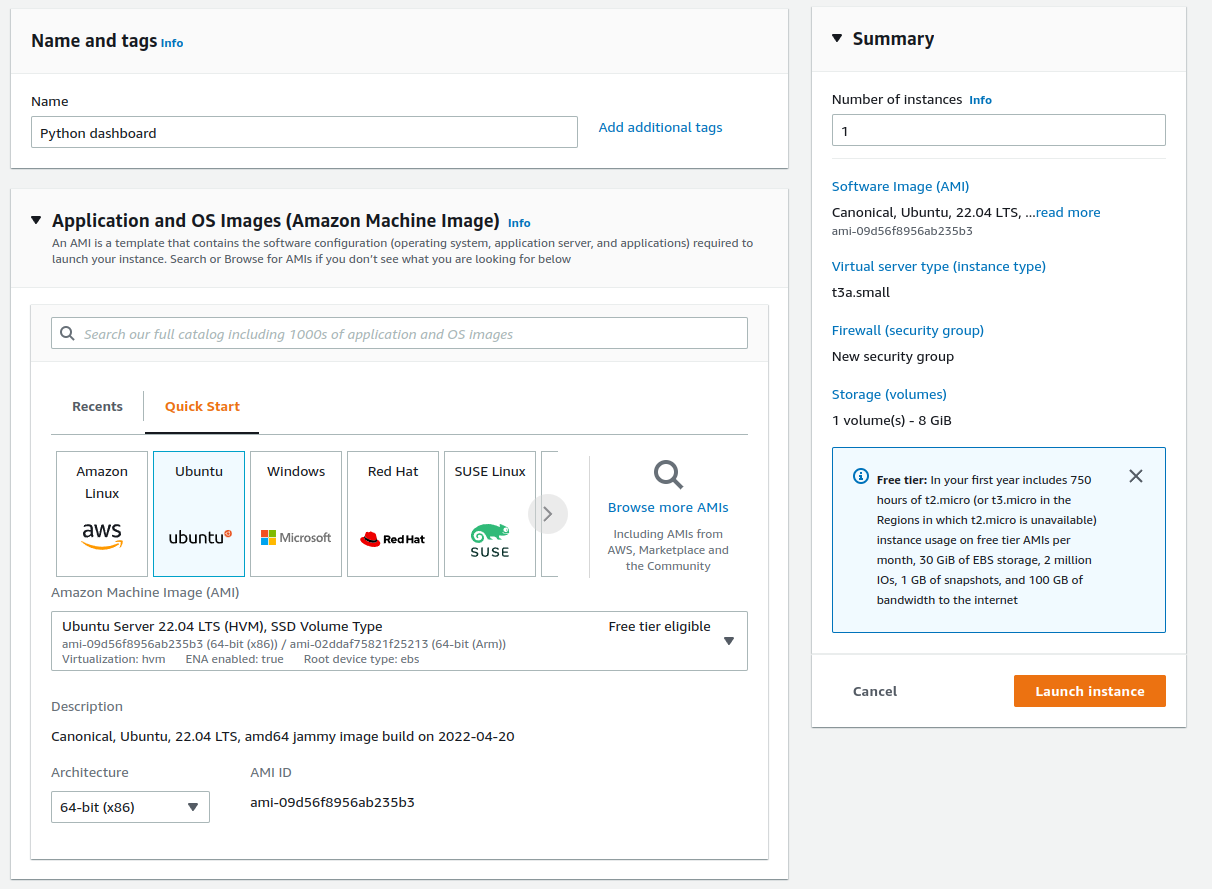
It is important to allow HTTPS and HTTP traffic to the machine:
After machine start I set a route in Route 53 service with A record pointing to the IP of the machine. The A record has the python-dashboard.mljar.com address.
Please login to the machine (there should be Connect button in AWS instances view). The machine should have the git already installed. We will need to install docker and docker-compose:
# install docker
sudo apt-get update
sudo apt install docker.io
# check if installed
sudo docker --version

# install docker-compose
sudo curl -L https://github.com/docker/compose/releases/latest/download/docker-compose-$(uname -s)-$(uname -m) -o /usr/local/bin/docker-compose
sudo chmod +x /usr/local/bin/docker-compose
# check if installed
sudo docker-compose version
OK, we can now clone the python-dashboard repository to the server:
git clone https://github.com/pplonski/python-dashboard.git
The next step is to setup the Mercury server. We need to clone the Mercury repository:
git clone https://github.com/mljar/mercury.git
Please enter the mercury directory and copy the .env.example file:
cp .env.example .env
Please edit the .env file with your values (remember not to commit the .env file to the GitHub):
DEBUG=False
SERVE_STATIC=False
DJANGO_SUPERUSER_USERNAME=piotr-super-user
DJANGO_SUPERUSER_PASSWORD=a-password-top-secret
DJANGO_SUPERUSER_EMAIL=piotr@piotr.pl
SECRET_KEY="x3%q8fs(-q3i(m&=e1g%9xtvcn*q!c%i@v0*ha4-some-secred"
ALLOWED_HOSTS=python-dashboard.mljar.com
NOTEBOOKS_PATH=../python-dashboard/
TIME_ZONE=Europe/Warsaw
WELCOME=/app/notebooks/welcome.md
EMAIL_ADDRESS=my-gmail-address@gmail.com
EMAIL_PASSWORD=my-app-password-generated-in-gmail
The important variables that need to be set:
ALLOWED_HOSTS- the comma-separated hosts, I used here the domain name. If you don't have a domain, you can use the IP address.NOTEBOOKS_PATH- the path to the folder with notebooks. In our case, it is../python-dashboard/.TIME_ZONE- the timezone that will be used for scheduling (you can read more about scheduling in the docs).WELCOME- the path to the welcome message. The welcome message is in Markdown in the same directory as notebooks.EMAIL_ADDRESSandEMAIL_PASSWORD- credentials used in notebookEmailServiceclass.
I will use the docker-compose-pro.yaml for starting the Mercury server. You can use it if you have a domain name available. It will set you a Let's Encrypt HTTPS certificate. It will work without Pro License. However, the Pro features won't be available.
There is a setup-pro.sh script to start the docker-compose and initialize certificates. You need to pass the domain name at the start:
./setup-pro.sh python-dashboard.mljar.com
It will issue the certificate and start docker-compose with docker-compose-pro.yaml configuration in the background. That's all. The server should be running after a short while. You can access it at https://python-dashboard.mljar.com.
You can stop the server with:
sudo docker-compose down
To start the server, please run:
sudo docker-compose up --build -d
It might be needed to update the notebook's code.
Summary
The Python language is amazing. It can be used to create so many different things. The Jupyter Notebook mixes the Python power with Markdown text and plots. It makes endless possibilities for creation. The data dashboard with live data from the Internet sources was created with Python only - no additional markup and web languages like HTML, JS, or CSS. The dashboard is published as a web application thanks to the open-source Mercury framework. What is more, the dashboard is automatically executed on the schedule. The publishing tools like Mercury makes it easy to share Jupyter Notebooks with non-technical users because code can be hidden.
The Mercury is an open-source framework. If you are a business user looking for a commercial-friendly license with additional features (like authentication) and dedicated support, please check our website for more details.
AI Data Analyst on Your Computer
Use MLJAR Studio to explore data, find insights, and create reports with AI. Everything runs locally, so your data stays with you.
About the Authors


Related Articles
- The 5 ways how to style text in Jupyter Notebook
- How to share Jupyter Notebook with non-programmers?
- The 4 ways to export Jupyter Notebook as PDF
- How to hide code in Jupyter Notebook?
- The 4 ways to insert images in Jupyter Notebook
- The 4 ways to install Jupyter Notebook
- How to create a dashboard in Python with Jupyter Notebook?
- How to send email in Python? (the simplest approach)
- Dashboard for Data Drift Detection in Python
- Automated PDF Reports with Python