AutoML Student Performance Use Case
How AutoML Can Help
In this use case, we explore a dataset from two Portuguese schools that looks at secondary education student accomplishment. This dataset includes a wide range of characteristics gathered from school reports and surveys, including student grades, demographic information, social variables, and school-related elements. Predicting students final grades using these inputs is the aim. By automating the creation of prediction models, MLJAR AutoML can speed up this procedure and provide a thorough examination of the variables affecting academic achievement. We can quickly identify key predictors of student success and generate actionable insights to improve educational strategies and support systems by utilizing the sophisticated algorithms and automated model evaluation of MLJAR AutoML. This will ultimately assist educators in making data-driven decisions to improve student outcomes.
Business Value
25%
More Accurate
MLJAR AutoML can improve prediction accuracy of student outcomes by up to 25% by automating model selection and refining. This increased accuracy makes it easier to detect at-risk pupils and create interventions that work.
30%
Lower costs
MLJAR AutoML can reduce the expenses of data science skills and model generation by up to 30% by automating complicated data analysis tasks. This makes advanced analytical tools more affordable for educational institutions with tight budgets.
40%
Resource Optimization
By putting MLJAR into practice, AutoML can reduce the amount of time spent on data preprocessing and model validation by up to 40%, freeing up resources for educational institutions that can be better spent implementing practical strategies rather than managing data.
AutoML Report
Because of its ability to provide comprehensive reports with informative data, MLJAR AutoML provides deep insights into model performance, data analysis, and evaluation measures. Below are a few instances of this kind.
Leaderboard
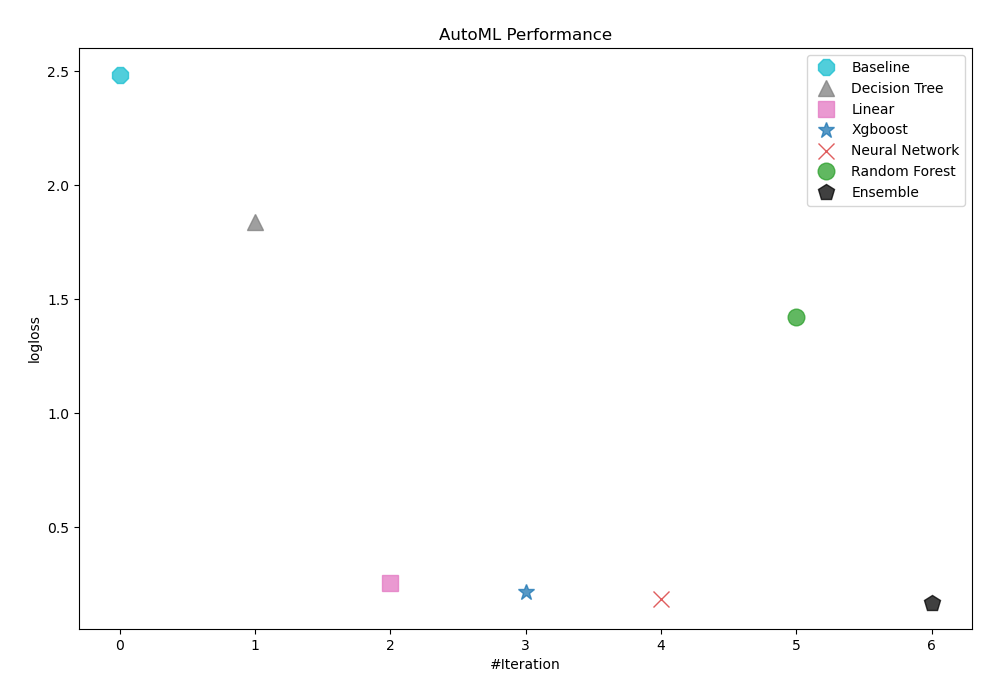
To evaluate the effectiveness of trained models, AutoML has used logloss as its performance measure. As can be seen in the table and graph below, Ensemble was consequently chosen as the best model.
| Best model | name | model_type | metric_type | metric_value | train_time |
|---|---|---|---|---|---|
| 1_Baseline | Baseline | logloss | 2.48491 | 0.76 | |
| 2_DecisionTree | Decision Tree | logloss | 1.83772 | 20.24 | |
| 3_Linear | Linear | logloss | 0.25672 | 15.34 | |
| 4_Default_Xgboost | Xgboost | logloss | 0.213171 | 9.17 | |
| 5_Default_NeuralNetwork | Neural Network | logloss | 0.184801 | 1.22 | |
| 6_Default_RandomForest | Random Forest | logloss | 1.42314 | 17.79 | |
| the best | Ensemble | Ensemble | logloss | 0.168914 | 0.29 |
AutoML Performance
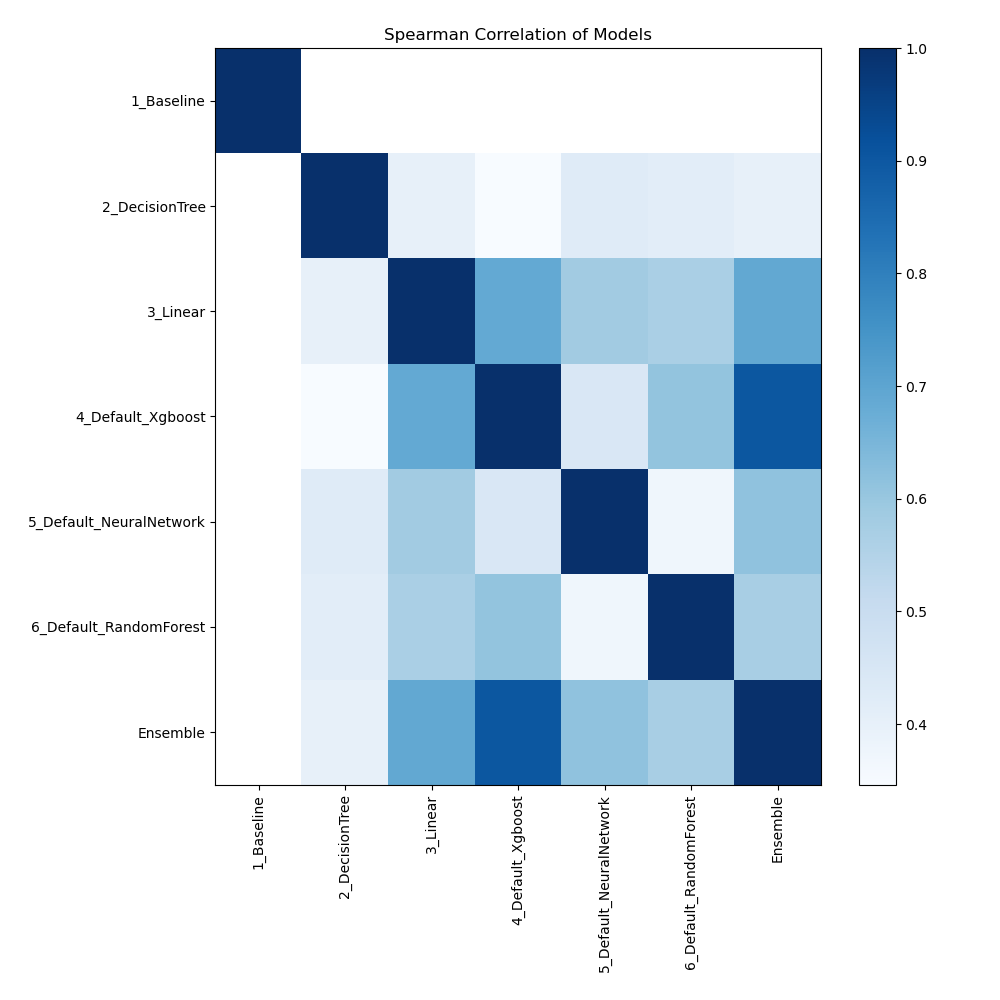
Spearman Correlation of Models
The graphic illustrates how important different features are in relation to different models. Each cell in this heatmap shows the significance of a single characteristic for a certain model, and the color intensity corresponds to the degree of significance. Lighter colors suggest lesser importance, while darker or more vivid colors indicate higher importance. By comparing the contributions of various models, this visualization aids in identifying which elements regularly contribute significantly to prediction performance and which have less of an impact.
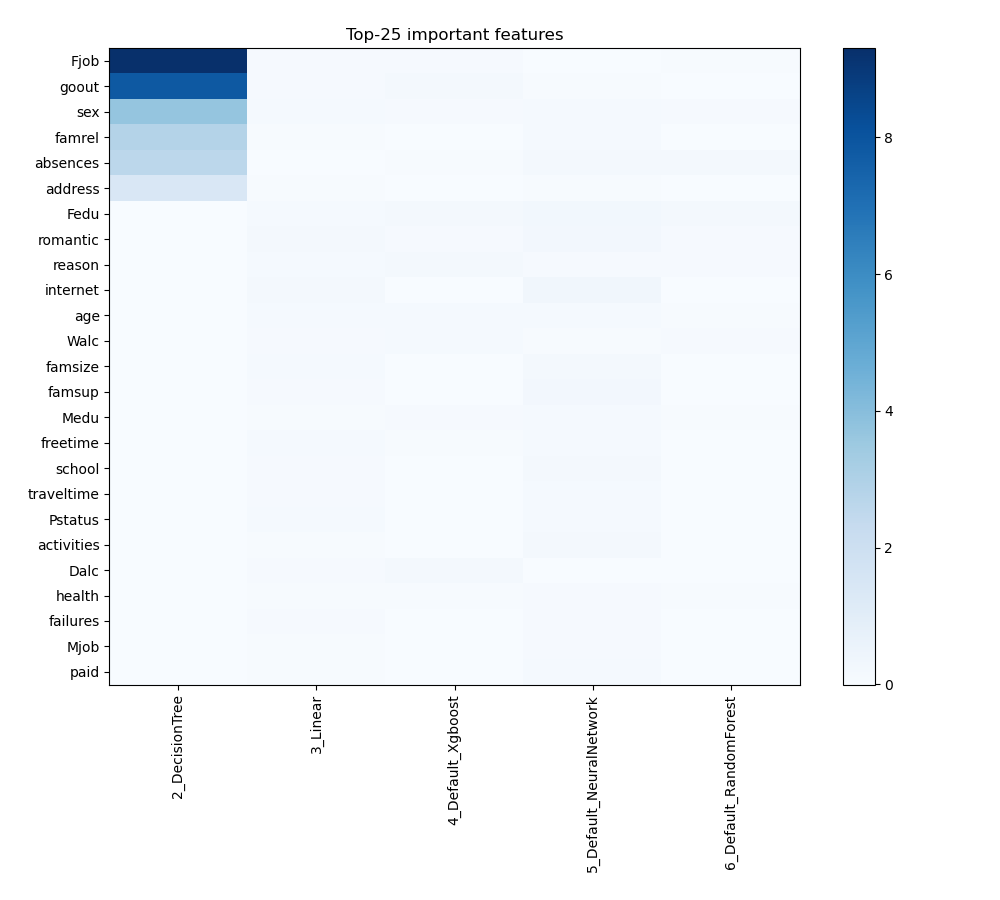
Feature Importance
The plot visualizes the significance of various features across different models. In this heatmap, each cell represents the importance of a specific feature for a particular model, with the color intensity indicating the level of importance. Darker or more intense colors signify higher importance, while lighter colors indicate lower importance. This visualization helps in comparing the contribution of features across multiple models, highlighting which features consistently play a critical role and which are less influential in predictive performance.
Install and import necessary packages
Install the packages with the command:
pip install pandas, mljar-supervised, scikit-learn
Import the packages into your code:
# import packages
import pandas as pd
from sklearn.model_selection import train_test_split
from supervised import AutoML
from sklearn.metrics import accuracy_score
Load dataset
Import the dataset containing information about students performance.
# read data from csv file
df = pd.read_csv(r"C:\Users\my_notebooks\student\student-por.csv", delimiter=";")
# display data shape
print(df.shape)
# display first rows
df.head()
(649, 33)
| school | sex | age | address | famsize | Pstatus | Medu | Fedu | Mjob | Fjob | ... | famrel | freetime | goout | Dalc | Walc | health | absences | G1 | G2 | G3 | |
|---|---|---|---|---|---|---|---|---|---|---|---|---|---|---|---|---|---|---|---|---|---|
| 0 | GP | F | 18 | U | GT3 | A | 4 | 4 | at_home | teacher | ... | 4 | 3 | 4 | 1 | 1 | 3 | 4 | 0 | 11 | 11 |
| 1 | GP | F | 17 | U | GT3 | T | 1 | 1 | at_home | other | ... | 5 | 3 | 3 | 1 | 1 | 3 | 2 | 9 | 11 | 11 |
| 2 | GP | F | 15 | U | LE3 | T | 1 | 1 | at_home | other | ... | 4 | 3 | 2 | 2 | 3 | 3 | 6 | 12 | 13 | 12 |
| 3 | GP | F | 15 | U | GT3 | T | 4 | 2 | health | services | ... | 3 | 2 | 2 | 1 | 1 | 5 | 0 | 14 | 14 | 14 |
| 4 | GP | F | 16 | U | GT3 | T | 3 | 3 | other | other | ... | 4 | 3 | 2 | 1 | 2 | 5 | 0 | 11 | 13 | 13 |
5 rows × 33 columns
Select features and target
We will split the dataset into features (X) and target (y) variables for model training.
# create X columns list and set y column
x_cols = ["school", "sex", "age", "address", "famsize", "Pstatus", "Medu", "Fedu", "Mjob", "Fjob", "reason", "guardian", "traveltime", "studytime", "failures", "schoolsup", "famsup", "paid", "activities", "nursery", "higher", "internet", "romantic", "famrel", "freetime", "goout", "Dalc", "Walc", "health", "absences"]
y_col = "G3"
# set input matrix
X = df[x_cols]
# set target vector
y = df[y_col]
# display data shapes
print(f"X shape is {X.shape}")
print(f"y shape is {y.shape}")
X shape is (649, 30)
y shape is (649,)
Split dataframe to train/test
To split a dataframe into train and test sets, we divide the data to create separate datasets for training and evaluating a model. This ensures we can assess the model's performance on unseen data.
This step is essential when you have only one base dataset.
# split data
X_train, X_test, y_train, y_test = train_test_split(X, y, train_size=0.90, shuffle=True, random_state=42)
# display data shapes
print(f"X_train shape {X_train.shape}")
print(f"X_test shape {X_test.shape}")
print(f"y_train shape {y_train.shape}")
print(f"y_test shape {y_test.shape}")
X_train shape (584, 30)
X_test shape (65, 30)
y_train shape (584,)
y_test shape (65,)
Fit AutoML
We need to train a model for our dataset. The fit() method will handle the model training and optimization automatically.
# create automl object
automl = AutoML(total_time_limit=300, mode="Explain")
# train automl
automl.fit(X_train, y_train)
Compute predictions
Use the trained AutoML model to make predictions on test data.
# predict with AutoML
predictions = automl.predict(X_test)
# predicted values
print(predictions)
[19 12 18 11 11 17 18  8 10 11 18 11 12  9 12 14 13  8 15 14 15 13 13 13
 16 13  8 12 10 15 16 12  9  8 18 16 17 15 14 11 13 10  8 11 14 12 18 12
 14 12 10 11 14 11 11 18 10 11 11 10  8 11 16 14 17]
Compute accuracy
We are comparing valid values with our predictions. To do that we will use accuracy score.
# compute metric
metric_accuracy = accuracy_score(y_test, predictions)
print(f"Accuracy: {metric_accuracy}")
Accuracy: 0.9692307692307692
Conlusions
By improving predictive accuracy and expediting the model development process, MLJAR AutoML provides a number of noteworthy benefits when it comes to student performance prediction. MLJAR AutoML expedites the development of efficient models and enhances the accuracy of student outcome predictions by automating the intricate analysis of a variety of demographic and educational data. With the help of this sophisticated automation, researchers and educators can quickly analyze big datasets and find important patterns and insights that would have gone unnoticed using more conventional techniques. Consequently, educational institutions can enhance their ability to make data-driven decisions, optimize their teaching strategies, and better support student achievement with the help of MLJAR AutoML. This leads to improvements in student achievement and academic performance.
See you soon👋.