AutoML Sales Use Case
How AutoML Can Help
In this instance, a bank marketing dataset will be used. Its purpose is to forecast, based on a marketing effort, the probability that a consumer will sign up for a term deposit. 45,211 data samples of bank customers make up this extensive dataset. They include a range of attributes like age, employment, marital status, education level, and past campaign results. Our goal is to create predictive models that can precisely anticipate the chance of a customer subscribing using this dataset. This will enable banks to improve their marketing tactics and raise the efficacy of their campaigns. Banks' approaches to data analysis, customer interaction, and marketing are being completely transformed by AutoML. MLJAR AutoML provides many advantages through model development process automation that result in notable business growth.
Business Value
25%
More Accurate
Compared to conventional techniques, MLJAR AutoML can increase consumer segmentation accuracy by roughly 25%, allowing for more focused targeting and customized marketing campaigns.
20%
Higher ROIs
MLJAR AutoML's real-time campaign performance analysis can assist boost marketing ROI by about 20% by offering actionable insights that facilitate more rapid strategy revisions.
30%
Faster Production
MLJAR AutoML may speed up the generation of customized emails, advertisements, and social media posts by around 30%, hence improving efficiency and engagement.
40%
More Efficient
By using MLJAR AutoML to automate data analysis and predictive modeling, teams may increase productivity and efficiency by about 40% while concentrating more on strategic activities rather than tedious analysis.
AutoML Report
With its ability to generate comprehensive reports rich with valuable information, MLJAR AutoML provides deep knowledge into model performance, data analysis, and assessment measures. Here are a few illustrations.
Leaderboard
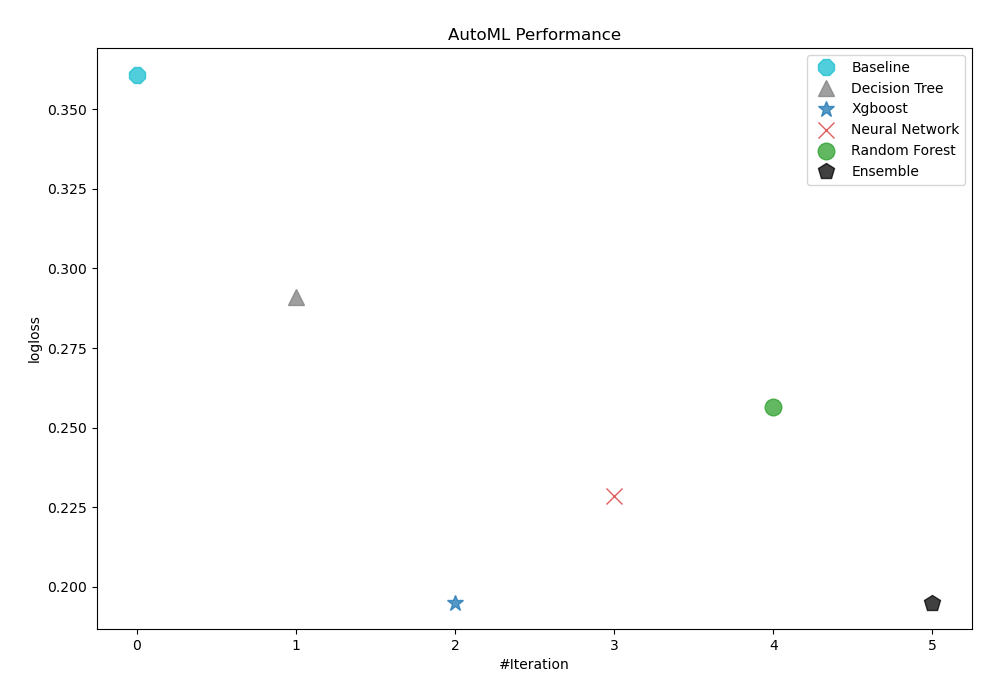
The metric that AutoML employed to assess model performance was logloss. The best model was determined to be 3_Default_Xgboost, as can be seen in the table and graph below.
| Best model | name | model_type | metric_type | metric_value | train_time |
|---|---|---|---|---|---|
| 1_Baseline | Baseline | logloss | 0.360857 | 1.16 | |
| 2_DecisionTree | Decision Tree | logloss | 0.290959 | 19.17 | |
| the best | 3_Default_Xgboost | Xgboost | logloss | 0.195108 | 9.18 |
| 4_Default_NeuralNetwork | Neural Network | logloss | 0.22854 | 6.59 | |
| 5_Default_RandomForest | Random Forest | logloss | 0.256554 | 7.77 | |
| Ensemble | Ensemble | logloss | 0.195108 | 2.24 |
AutoML Performance
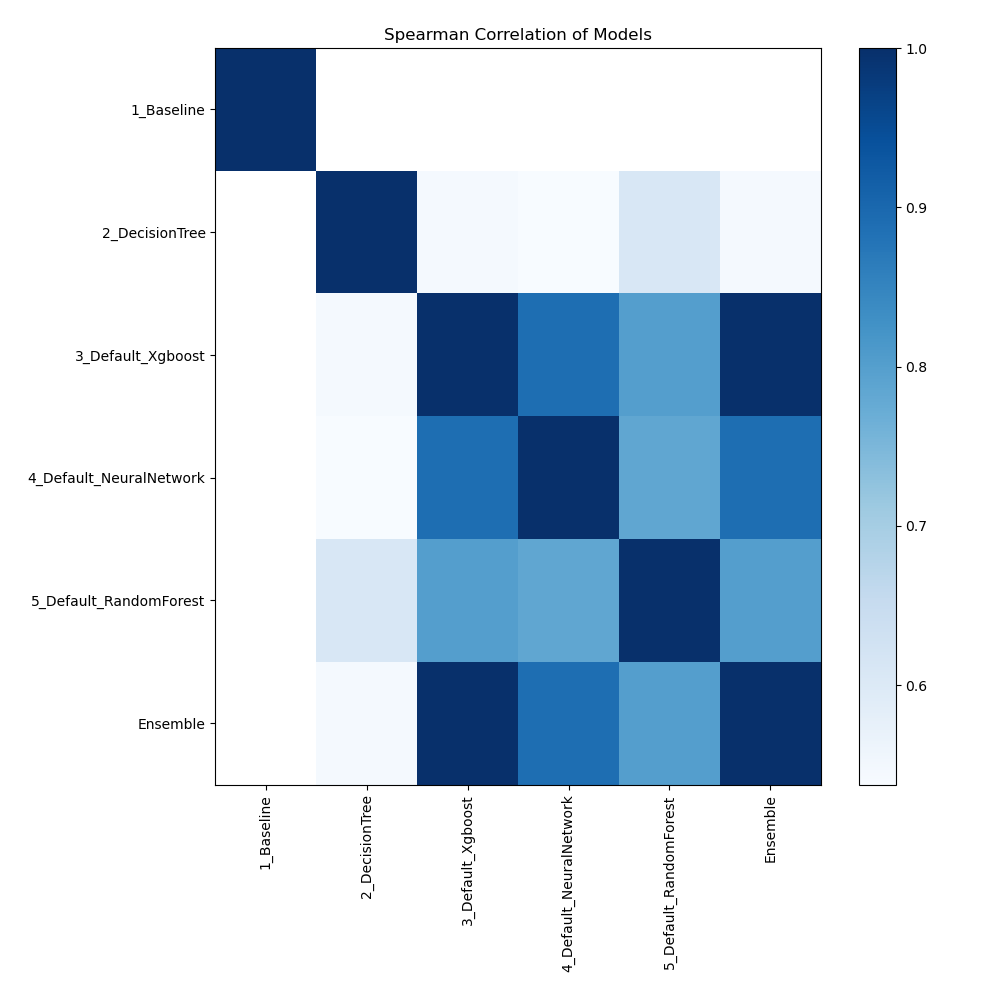
Spearman Correlation of Models
The heatmap shows the pairwise Spearman correlation coefficients between multiple models. The degree and direction of the monotonic relationship between the two models' predictions are shown by each cell. Strong correlations are shown by values near to 1, and weak or no correlations are indicated by values near to 0. This heatmap makes it easier to see how well various models order data points in relation to one another.
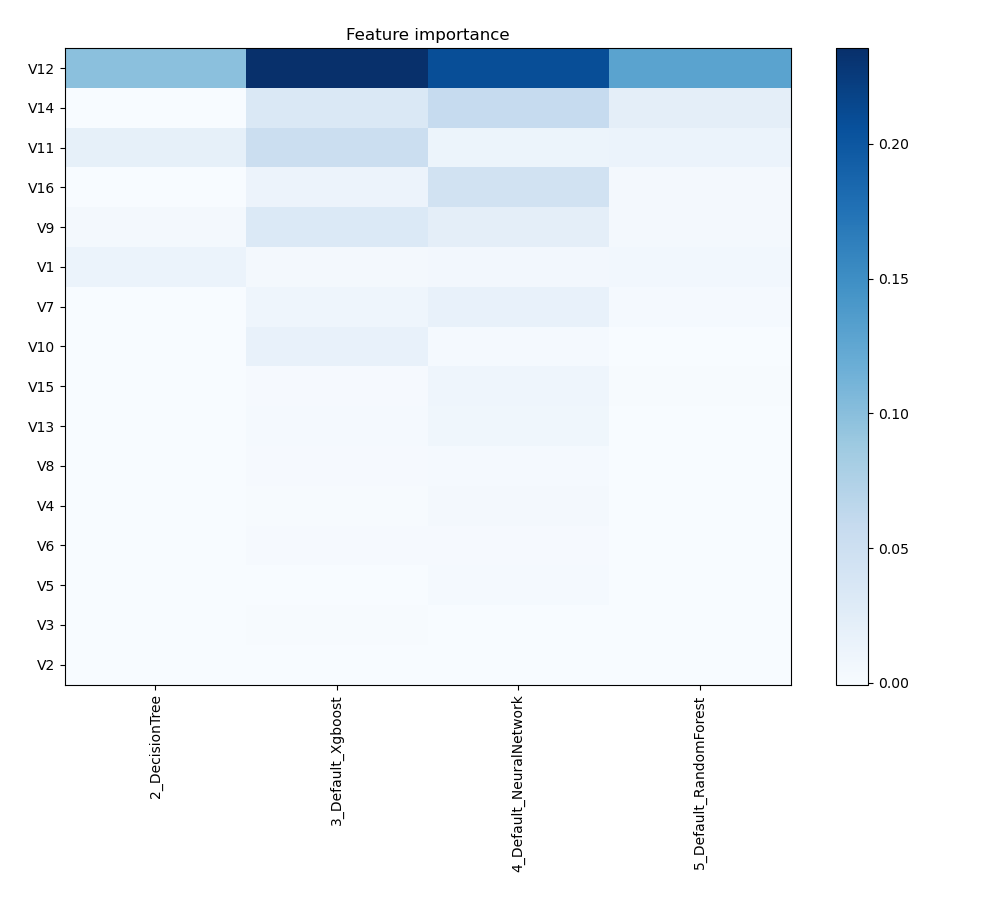
Feature Importance
The graph shows how different features impact the model's prediction accuracy. Larger numbers denote greater significance. Each attribute is given a value based on how much it increases the prediction power of the model. This visualization helps in determining which features have the greatest impact on the model's performance, helping to focus efforts on feature selection and model interpretation.
Install and import necessary packages
Install the packages with the command:
pip install mljar-supervised, scikit-learn
Import the packages into your code:
# import packages
from supervised import AutoML
from sklearn.datasets import fetch_openml
from sklearn.model_selection import train_test_split
from sklearn.metrics import accuracy_score
Load data
Import relevant data from an OpenML dataset.
# load dataset
data = fetch_openml(data_id=1461, as_frame=True)
X = data.data
y = data.target
# display data shape
print(f"Loaded X shape {X.shape}")
print(f"Loaded y shape {y.shape}")
# display first rows
X.head()
Loaded X shape (45211, 16)
Loaded y shape (45211,)
| V1 | V2 | V3 | V4 | V5 | V6 | V7 | V8 | V9 | V10 | V11 | V12 | V13 | V14 | V15 | V16 | |
|---|---|---|---|---|---|---|---|---|---|---|---|---|---|---|---|---|
| 0 | 58 | management | married | tertiary | no | 2143 | yes | no | unknown | 5 | may | 261 | 1 | -1 | 0 | unknown |
| 1 | 44 | technician | single | secondary | no | 29 | yes | no | unknown | 5 | may | 151 | 1 | -1 | 0 | unknown |
| 2 | 33 | entrepreneur | married | secondary | no | 2 | yes | yes | unknown | 5 | may | 76 | 1 | -1 | 0 | unknown |
| 3 | 47 | blue-collar | married | unknown | no | 1506 | yes | no | unknown | 5 | may | 92 | 1 | -1 | 0 | unknown |
| 4 | 33 | unknown | single | unknown | no | 1 | no | no | unknown | 5 | may | 198 | 1 | -1 | 0 | unknown |
Split dataframe to train/test
To split a dataframe into train and test sets, we divide the data to create separate datasets for training and evaluating a model. This ensures we can assess the model's performance on unseen data.
This step is essential when you have only one base dataset.
# split data
X_train, X_test, y_train, y_test = train_test_split(X, y, train_size=0.90, shuffle=True, stratify=y, random_state=42)
# display data shapes
print(f"X_train shape {X_train.shape}")
print(f"y_train shape {y_train.shape}")
print(f"X_test shape {X_test.shape}")
print(f"y_test shape {y_test.shape}")
X_train shape (40689, 16)
y_train shape (40689,)
X_test shape (4522, 16)
y_test shape (4522,)
Fit AutoML
We need to train a model for our dataset. The fit() method will handle the model training and optimization automatically.
# create automl object
automl = AutoML(total_time_limit=600, mode="Explain")
# train automl
automl.fit(X_train, y_train)
Compute predictions
Generate predictions on the test data and display the results.
# predict with AutoML
predictions = automl.predict(x_test)
# predicted values
print(predictions)
['1' '1' '1' ... '1' '1' '1']
Compute accuracy
We are computing the accuracy score and valid values (y_test) with our predictions.
# compute metric
metric_accuracy = accuracy_score(y_test, predictions)
print(f"Accuracy: {metric_accuracy}")
Accuracy: 0.9040247678018576
Conclusions
Significant advantages are provided by MLJAR AutoML in sales and marketing. By automating intricate data analysis, it makes precise forecasts, focused marketing campaigns, and customized client interactions possible. AutoML can find patterns and insights that traditional methods might miss because of its efficiency in handling massive datasets. With the development of this technology, sales and marketing will be more and more impacted, which will improve consumer interaction and result in more successful business plans.
See you soon👋.