AutoML Financial Use Case
How AutoML Can Help
In our case, we are going to use a credit scoring dataset. It is designed to predict the likelihood that an individual will experience financial difficulties in the next two years. This comprehensive dataset contains 150,000 data samples of individuals, which include various characteristics such as age, monthly income, debt ratio, number of dependents, and more. By analyzing this dataset, we aim to develop predictive models that accurately estimate the likelihood of financial distress, helping institutions make informed credit decisions and implement proactive risk management strategies. MLJAR AutoML is revolutionizing financial institutions' approaches to credit scoring, risk management, and data analysis. By automating the model development process, MLJAR AutoML offers numerous benefits that translate into significant business growth.
Business Value
25%
More Accurate
Compared to conventional techniques, MLJAR AutoML may produce predictions that are up to 25% more accurate, which enhances decision-making and lowers financial losses.
40%
Less Time
MLJAR AutoML can save around 40% more time and resources by reducing the need for complex coding and manual changes, freeing teams to concentrate on important priorities.
30%
Faster
Using MLJAR AutoML to automate model development can speed up the process by roughly 30% while cutting expenses and increasing output.
20%
More Insightful
Institutions can get a competitive edge by utilizing MLJAR AutoML's sophisticated data analysis capabilities, which can yield around 20% deeper insights from huge datasets.
AutoML Report
MLJAR AutoML generates a comprehensive report, offering a wealth of information that provides valuable insight into model performance, data analysis, and evaluation metrics. Some examples of these are shown below.
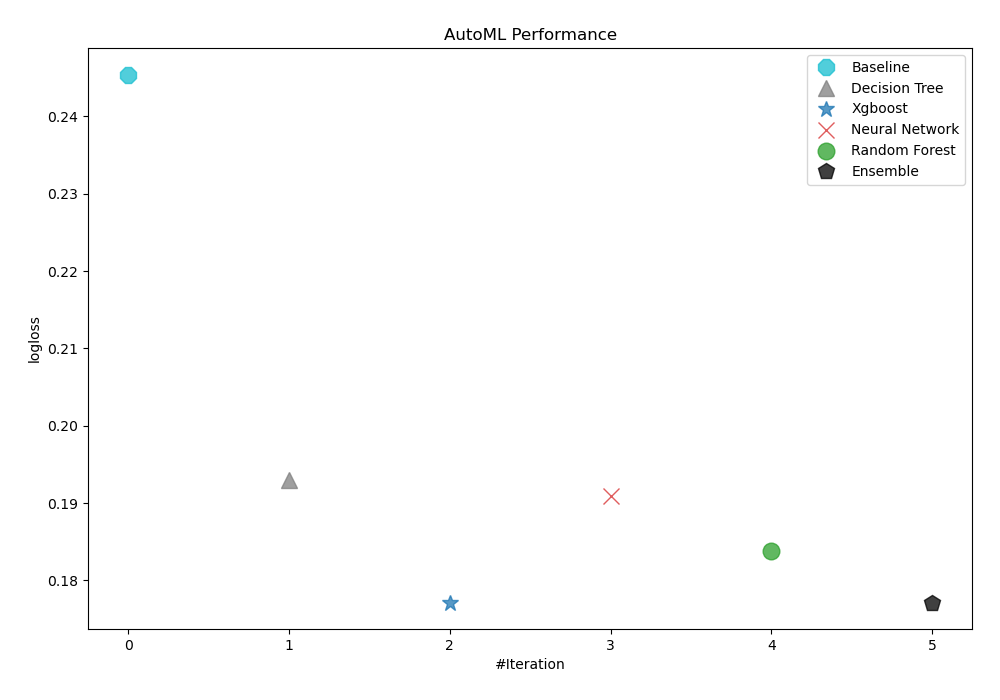
Leaderboard
To evaluate the effectiveness of trained models, AutoML has used logloss as its performance measure. As can be seen in the table and graph below, 3_Default_Xgboost was consequently chosen as the best model.
| Best model | name | model_type | metric_type | metric_value | train_time |
|---|---|---|---|---|---|
| 1_Baseline | Baseline | logloss | 0.245422 | 1.12 | |
| 2_DecisionTree | Decision Tree | logloss | 0.192961 | 21.89 | |
| the best | 3_Default_Xgboost | Xgboost | logloss | 0.177134 | 12.41 |
| 4_Default_NeuralNetwork | Neural Network | logloss | 0.190949 | 15.9 | |
| 5_Default_RandomForest | Random Forest | logloss | 0.18375 | 15.63 | |
| Ensemble | Ensemble | logloss | 0.177134 | 4.43 |
Performance
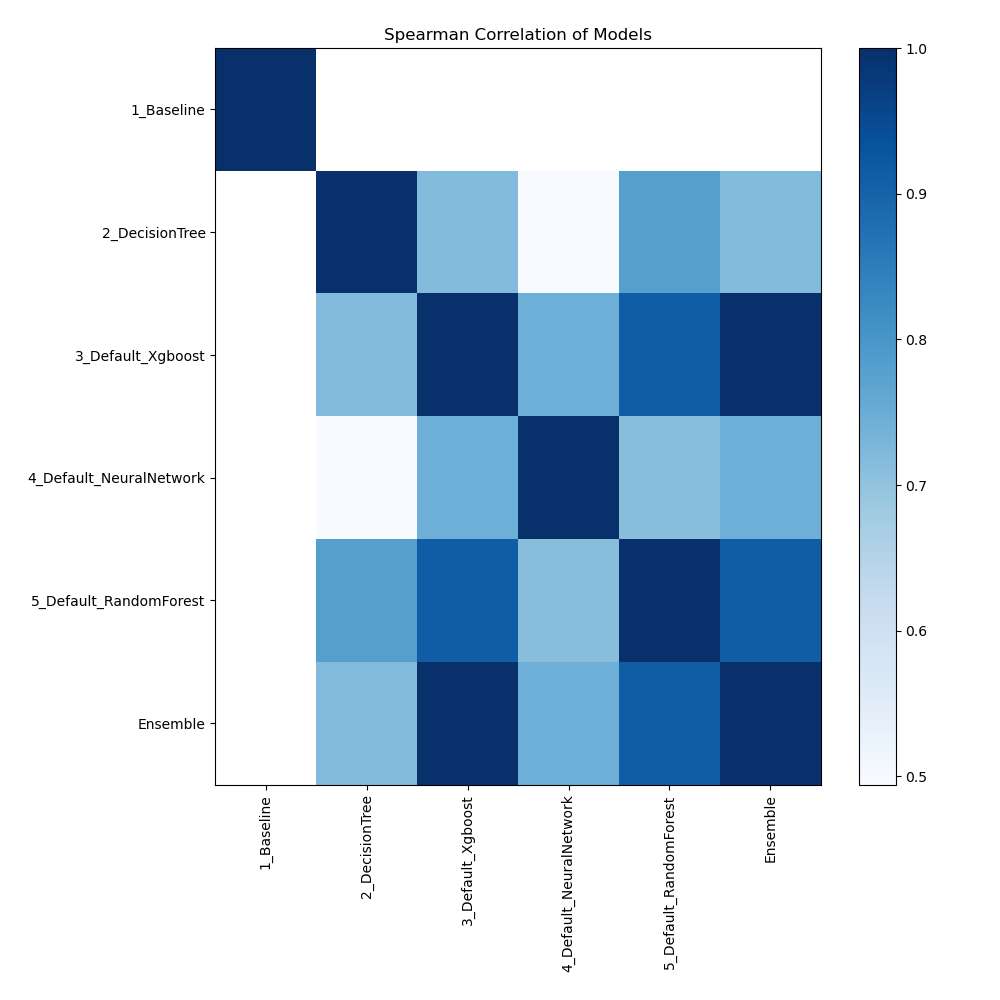
Spearman Correlation of Models
The plot illustrates the relationships between different models based on their rank-order correlation. Spearman correlation measures how well the relationship between two variables can be described using a monotonic function, highlighting the strength of the models' performance rankings. Higher correlation values indicate stronger relationships, where models perform similarly across different metrics or datasets.
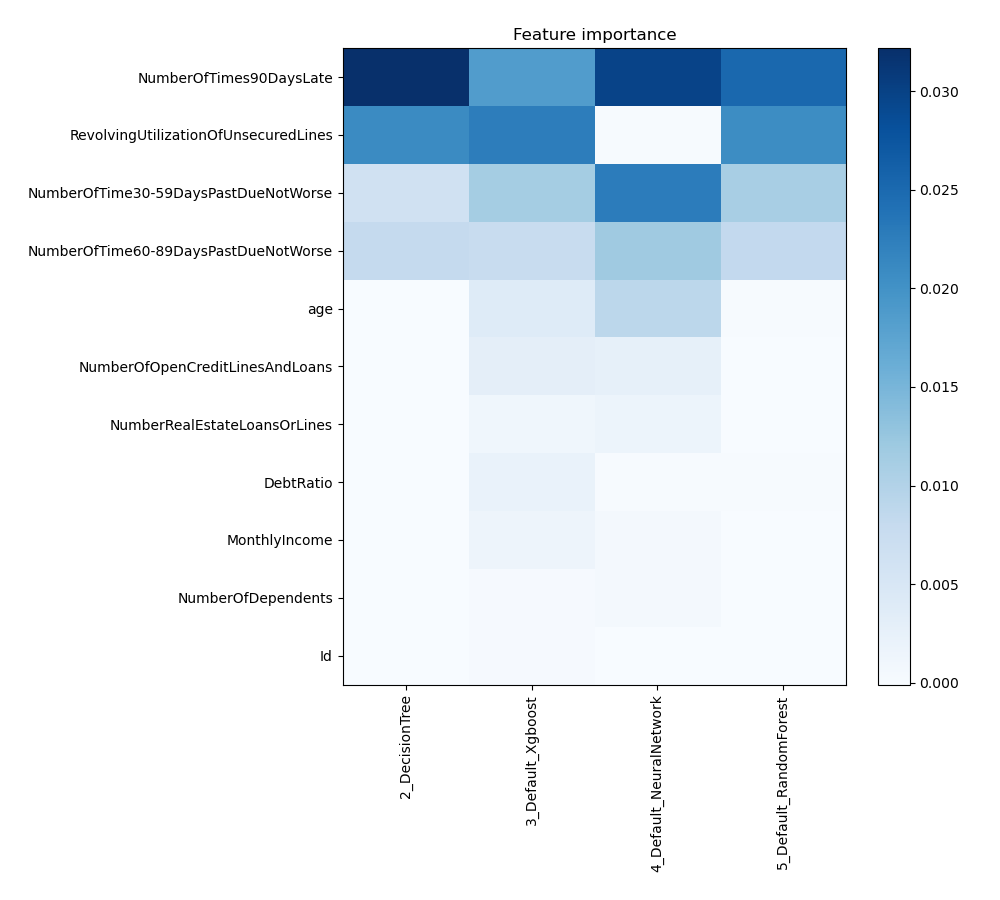
Feature Importance
The plot visualizes the significance of various features across different models. In this heatmap, each cell represents the importance of a specific feature for a particular model, with the color intensity indicating the level of importance. Darker or more intense colors signify higher importance, while lighter colors indicate lower importance. This visualization helps in comparing the contribution of features across multiple models, highlighting which features consistently play a critical role and which are less influential in predictive performance.
Install and import necessary packages
Install the packages with the command:
pip install pandas, scikit-learn, mljar-supervised
Import the packages into your code:
# import packages
import pandas as pd
from sklearn.model_selection import train_test_split
from supervised import AutoML
from sklearn.metrics import accuracy_score
Load data
Import relevant financial data for credit scoring analysis.
# load example dataset
df = pd.read_csv("https://raw.githubusercontent.com/pplonski/datasets-for-start/master/credit/data.csv")
# display DataFrame shape
print(f"Loaded data shape {df.shape}")
# display first rows
df.head()
Loaded data shape (150000, 12)
| Id | SeriousDlqin2yrs | RevolvingUtilizationOfUnsecuredLines | age | NumberOfTime30-59DaysPastDueNotWorse | DebtRatio | MonthlyIncome | NumberOfOpenCreditLinesAndLoans | NumberOfTimes90DaysLate | NumberRealEstateLoansOrLines | NumberOfTime60-89DaysPastDueNotWorse | NumberOfDependents | |
|---|---|---|---|---|---|---|---|---|---|---|---|---|
| 0 | 1 | 1 | 0.766127 | 45 | 2 | 0.802982 | 9120.0 | 13 | 0 | 6 | 0 | 2.0 |
| 1 | 2 | 0 | 0.957151 | 40 | 0 | 0.121876 | 2600.0 | 4 | 0 | 0 | 0 | 1.0 |
| 2 | 3 | 0 | 0.658180 | 38 | 1 | 0.085113 | 3042.0 | 2 | 1 | 0 | 0 | 0.0 |
| 3 | 4 | 0 | 0.233810 | 30 | 0 | 0.036050 | 3300.0 | 5 | 0 | 0 | 0 | 0.0 |
| 4 | 5 | 0 | 0.907239 | 49 | 1 | 0.024926 | 63588.0 | 7 | 0 | 1 | 0 | 0.0 |
5 rows × 12 columns
Split dataframe to train/test
To split a dataframe into train and test sets, we divide the data to create separate datasets for training and evaluating a model. This ensures we can assess the model's performance on unseen data.
This step is essential when you have only one base dataset.
# split data
train, test = train_test_split(df, train_size=0.75, shuffle=True, random_state=42)
# display data shapes
print(f"All data shape {df.shape}")
print(f"Train shape {train.shape}")
print(f"Test shape {test.shape}")
All data shape (150000, 12)
Train shape (112500, 12)
Test shape (37500, 12)
Select X,y for ML training
We will split the training set into features (x_train) and target (y_train) variables for model training.
# create X columns list and set y column
x_cols = ["Id", "RevolvingUtilizationOfUnsecuredLines", "age", "NumberOfTime30-59DaysPastDueNotWorse", "DebtRatio", "MonthlyIncome", "NumberOfOpenCreditLinesAndLoans", "NumberOfTimes90DaysLate", "NumberRealEstateLoansOrLines", "NumberOfTime60-89DaysPastDueNotWorse", "NumberOfDependents"]
y_col = "SeriousDlqin2yrs"
# set input matrix
x_train = train[x_cols]
# set target vector
y_train = train[y_col]
# display data shapes
print(f"x_train shape is {x_train.shape}")
print(f"y_train shape is {y_train.shape}")
x_train shape is (112500, 11)
y_train shape is (112500,)
Select X,y for evaluating the ML model
We will split the test set into features (x_test) and target (y_test) variables to evaluate the model's performance.
# create X columns list and set y column
x_cols = ["Id", "RevolvingUtilizationOfUnsecuredLines", "age", "NumberOfTime30-59DaysPastDueNotWorse", "DebtRatio", "MonthlyIncome", "NumberOfOpenCreditLinesAndLoans", "NumberOfTimes90DaysLate", "NumberRealEstateLoansOrLines", "NumberOfTime60-89DaysPastDueNotWorse", "NumberOfDependents"]
y_col = "SeriousDlqin2yrs"
# set input matrix
x_test = test[x_cols]
# set target vector
y_test = test[y_col]
# display data shapes
print(f"x_test shape is {x_test.shape}")
print(f"y_test shape is {y_test.shape}")
x_test shape is (37500, 11)
y_test shape is (37500,)
Fit AutoML
We need to train a model for our dataset. The fit() method will handle the model training and optimization automatically.
# create automl object
automl = AutoML(total_time_limit=300, mode="Explain")
# train automl
automl.fit(x_train, y_train)
Compute predictions
Generate predictions on the test data and display the results.
# predict with AutoML
predictions = automl.predict(x_test)
# predicted values
print(predictions)
[0 0 0 ... 0 0 0]
Display result
We want to see clearly our predictions.
# create mapping dict
pred_mapping = {0: 'No', 1: 'Yes'}
# convert list using comprehension
cat_list = [pred_mapping[x] for x in predictions]
# create data frame and display it
result = pd.DataFrame(data = {"Difficulties": cat_list}, index=test["Id"])
result
| Id | Difficulties |
|---|---|
| 59771 | No |
| 21363 | No |
| 127325 | No |
| 140510 | No |
| 144298 | No |
| ... | ... |
| 77730 | No |
| 87367 | No |
| 135908 | No |
| 70825 | No |
| 40590 | No |
37500 rows × 1 columns
Compute accuracy
We are computing the accuracy score and valid values (y_test) with our predictions.
# compute metric
metric_accuracy = accuracy_score(y_test, predictions)
print(f"Accuracy: {metric_accuracy}")
Accuracy: 0.9376
Conclusions
The integration of MLJAR AutoML in the financial sector is a game-changer. AutoML provides highly accurate credit risk assessments, streamlined loan approvals, and enhanced fraud detection. By automating complex data analysis and decision-making processes, it enables financial institutions to make more informed, timely decisions while improving efficiency and reducing operational costs. As AutoML technology continues to evolve, its role in enhancing accuracy and reliability in credit scoring and other financial applications will become increasingly vital, driving innovation and growth in the industry.
See you soon👋.