AutoML Energy Usage Use Case
How AutoML Can Help
We are working with a large dataset (19,735 instances) in the Appliances Energy dataset use case, each of which shows the patterns of energy consumption of different home appliances over time. This dataset provides a comprehensive picture of how various devices affect total energy use by capturing features like appliance types, usage patterns, and temporal data. Predicting patterns of energy consumption and optimizing usage to reduce waste and expenses present a challenge. By automating model selection, hyperparameter tuning, and evaluation, MLJAR AutoML can expedite this procedure. Because of this automation, precise predictive models that estimate energy consumption, pinpoint the main causes of excessive consumption, and provide practical advice for improving energy efficiency can be developed. We can accelerate model development, increase prediction accuracy, and create more efficient plans for controlling and lowering household energy use by leveraging MLJAR AutoML.
Business Value
30%
Faster
The amount of effort required to extract meaningful insights from energy data can be reduced by around 30% because to the automation features of MLJAR AutoML. This facilitates expedited decision-making in the areas of waste reduction, energy consumption optimization, and sustainability program implementation.
40%
More Efficient
Large energy consumption datasets may be analyzed up to 40% faster with MLJAR AutoML, which makes it possible to find inefficiencies and optimization opportunities more quickly. This increase in efficiency results in the quicker application of energy-saving techniques and the prompt modification of energy management plans.
25%
Better Accuracy
When compared to conventional techniques, the sophisticated algorithms of MLJAR AutoML can increase the accuracy of energy usage projections by up to 25%. This improved accuracy aids in more accurate energy demand forecasts, which lowers operating costs and facilitates more efficient resource allocation.
40%
Quicker Model Development
MLJAR AutoML saves roughly 40% of the time and resources needed to construct predictive models by automating the processes of model selection and tuning. These financial savings could go toward other important projects like modernizing infrastructure or developing new energy-related technology.
AutoML Report
With its ability to generate comprehensive reports full of informative data, MLJAR AutoML provides deep insights into model performance, data analysis, and assessment measures. Here are a few of these instances.
Leaderboard
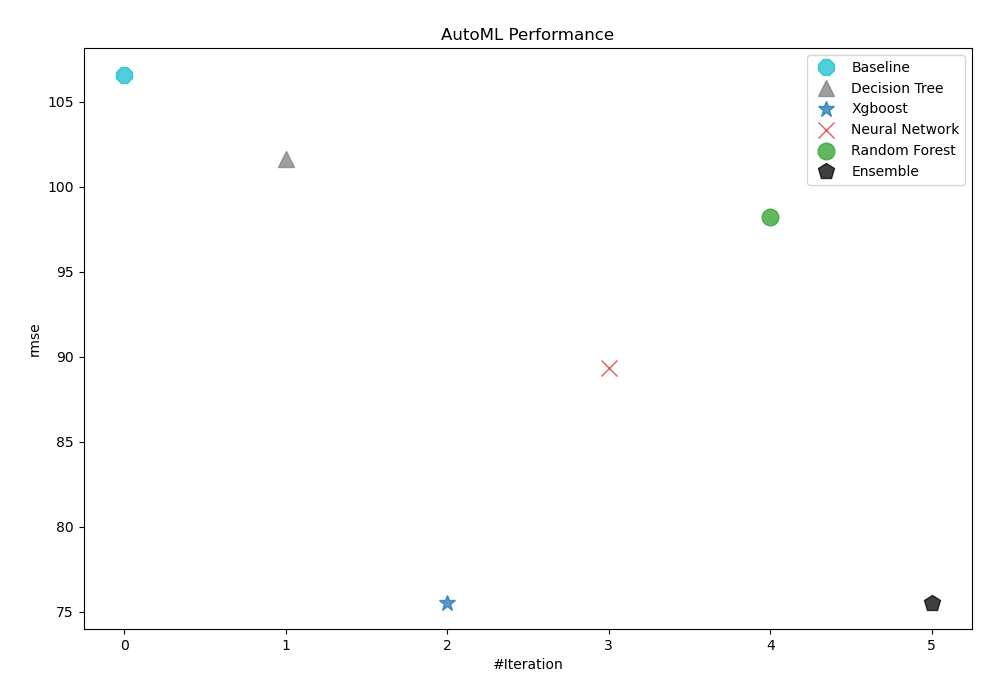
AutoML chose rmse as its performance measure to assess the value of trained models. As the table and graph below demonstrate, 3_Default_Xgboost was subsequently selected as the best possible model.
| Best model | name | model_type | metric_type | metric_value | train_time |
|---|---|---|---|---|---|
| 1_Baseline | Baseline | rmse | 106.587 | 0.59 | |
| 2_DecisionTree | Decision Tree | rmse | 101.641 | 8.03 | |
| the best | 3_Default_Xgboost | Xgboost | rmse | 75.5399 | 19.57 |
| 4_Default_NeuralNetwork | Neural Network | rmse | 89.3408 | 2.18 | |
| 5_Default_RandomForest | Random Forest | rmse | 98.1887 | 5.11 | |
| Ensemble | Ensemble | rmse | 75.5399 | 0.13 |
AutoML Performance
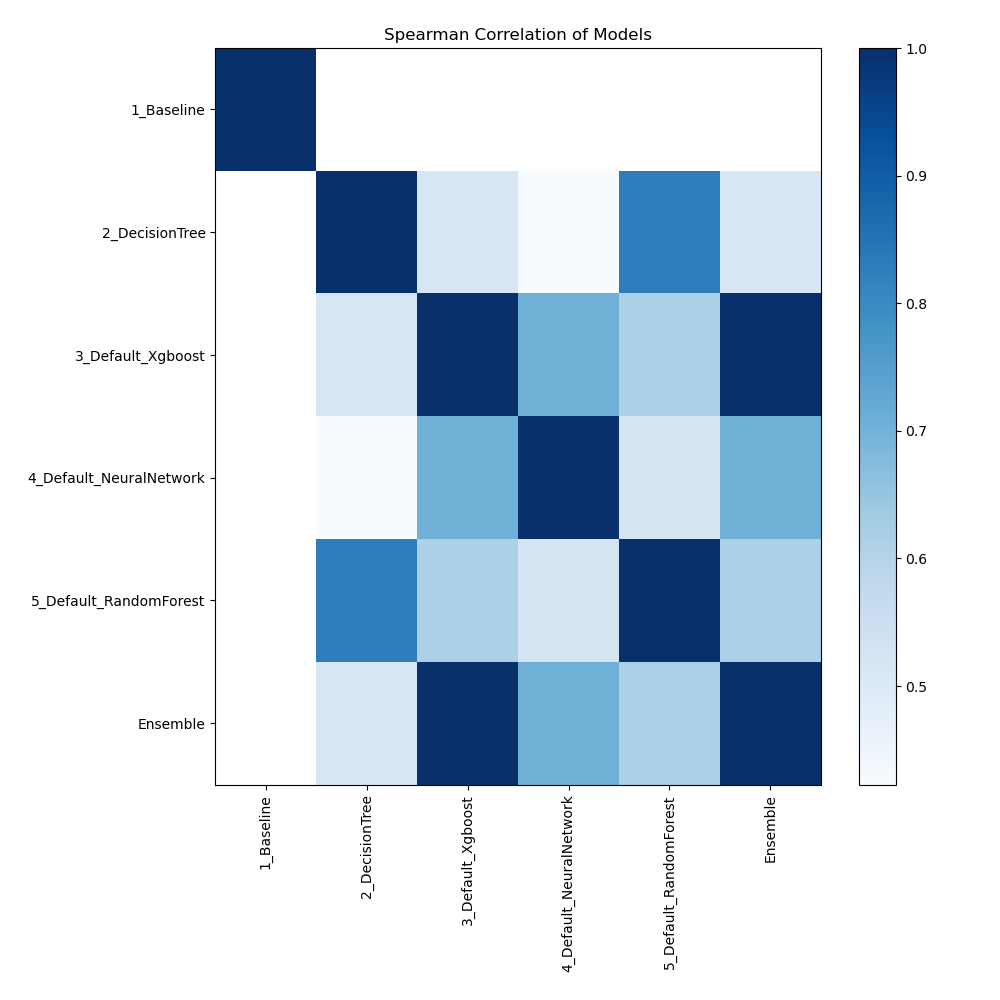
Spearman Correlation of Models
The relationships between various models are depicted in the figure according to their rank-order correlation. Spearman correlation highlights the strength of the models' performance rankings by measuring how effectively the relationship between two variables can be expressed using a monotonic function. Stronger associations are indicated by higher correlation values, indicating that models perform similarly across various measures or datasets.
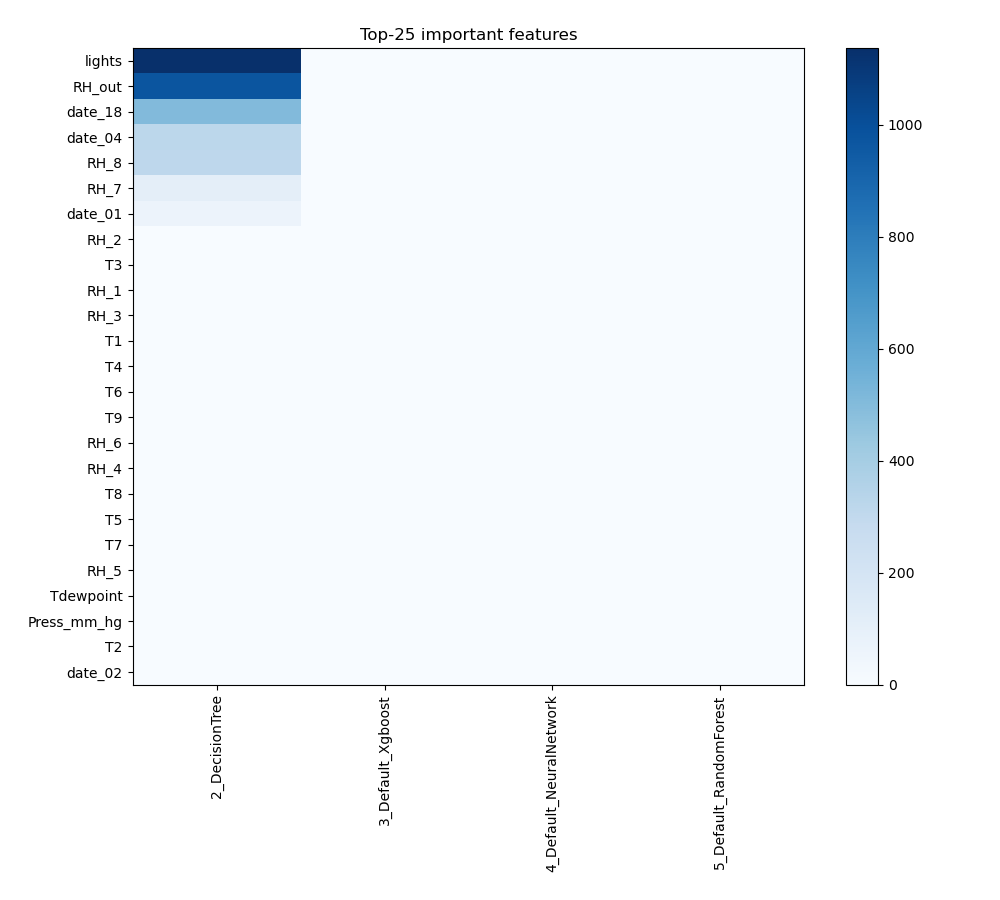
Feature Importance
The plot visualizes the significance of various features across different models. In this heatmap, each cell represents the importance of a specific feature for a particular model, with the color intensity indicating the level of importance. Darker or more intense colors signify higher importance, while lighter colors indicate lower importance. This visualization helps in comparing the contribution of features across multiple models, highlighting which features consistently play a critical role and which are less influential in predictive performance.
Install and import necessary packages
Install the packages with the command:
pip install pandas, mljar-supervised, scikit-learn
Import the packages into your code:
# import packages
import pandas as pd
from sklearn.model_selection import train_test_split
from supervised import AutoML
from sklearn.metrics import accuracy_score
Load data
Import the dataset containing information about energy appliances.
# read data from csv file
df = pd.read_csv(r"C:\Users\my_notebooks\energydata_complete.csv")
# display data shape
print(df.shape)
# display first rows
df.head()
(19735, 29)
| date | Appliances | lights | T1 | RH_1 | T2 | RH_2 | T3 | RH_3 | T4 | ... | T9 | RH_9 | T_out | Press_mm_hg | RH_out | Windspeed | Visibility | Tdewpoint | rv1 | rv2 | |
|---|---|---|---|---|---|---|---|---|---|---|---|---|---|---|---|---|---|---|---|---|---|
| 0 | 2016-01-11 17:00:00 | 60 | 30 | 19.89 | 47.596667 | 19.2 | 44.790000 | 19.79 | 44.730000 | 19.000000 | ... | 17.033333 | 45.53 | 6.600000 | 733.5 | 92.0 | 7.000000 | 63.000000 | 5.3 | 13.275433 | 13.275433 |
| 1 | 2016-01-11 17:10:00 | 60 | 30 | 19.89 | 46.693333 | 19.2 | 44.722500 | 19.79 | 44.790000 | 19.000000 | ... | 17.066667 | 45.56 | 6.483333 | 733.6 | 92.0 | 6.666667 | 59.166667 | 5.2 | 18.606195 | 18.606195 |
| 2 | 2016-01-11 17:20:00 | 50 | 30 | 19.89 | 46.300000 | 19.2 | 44.626667 | 19.79 | 44.933333 | 18.926667 | ... | 17.000000 | 45.50 | 6.366667 | 733.7 | 92.0 | 6.333333 | 55.333333 | 5.1 | 28.642668 | 28.642668 |
| 3 | 2016-01-11 17:30:00 | 50 | 40 | 19.89 | 46.066667 | 19.2 | 44.590000 | 19.79 | 45.000000 | 18.890000 | ... | 17.000000 | 45.40 | 6.250000 | 733.8 | 92.0 | 6.000000 | 51.500000 | 5.0 | 45.410389 | 45.410389 |
| 4 | 2016-01-11 17:40:00 | 60 | 40 | 19.89 | 46.333333 | 19.2 | 44.530000 | 19.79 | 45.000000 | 18.890000 | ... | 17.000000 | 45.40 | 6.133333 | 733.9 | 92.0 | 5.666667 | 47.666667 | 4.9 | 10.084097 | 10.084097 |
5 rows × 29 columns
Select features and target
We will split the dataset into features (X) and target (y) variables for model training.
# create X columns list and set y column
x_cols = ["date", "lights", "T1", "RH_1", "T2", "RH_2", "T3", "RH_3", "T4", "RH_4", "T5", "RH_5", "T6", "RH_6", "T7", "RH_7", "T8", "RH_8", "T9", "RH_9", "T_out", "Press_mm_hg", "RH_out", "Windspeed", "Visibility", "Tdewpoint", "rv1", "rv2"]
y_col = "Appliances"
# set input matrix
X = df[x_cols]
# set target vector
y = df[y_col]
# display data shapes
print(f"X shape is {X.shape}")
print(f"y shape is {y.shape}")
X shape is (19735, 28)
y shape is (19735,)
Split dataframe to train/test
To split a dataframe into train and test sets, we divide the data to create separate datasets for training and evaluating a model. This ensures we can assess the model's performance on unseen data.
# split data
X_train, X_test, y_train, y_test = train_test_split(X, y, train_size=0.95, shuffle=True, random_state=42)
# display data shapes
print(f"X_train shape {X_train.shape}")
print(f"X_test shape {X_test.shape}")
print(f"y_train shape {y_train.shape}")
print(f"y_test shape {y_test.shape}")
X_train shape (18748, 28)
X_test shape (987, 28)
y_train shape (18748,)
y_test shape (987,)
Fit AutoML
We need to train a model for our dataset. The fit() method will handle the model training and optimization automatically.
# create automl object
automl = AutoML(total_time_limit=300, mode="Explain")
# train automl
automl.fit(X_train, y_train)
Compute predictions
Use the trained AutoML model to make predictions on test data.
# predict with AutoML
predictions = automl.predict(X_test)
# predicted values
print(predictions)
[ 45.981655 180.34007   48.46944  188.92409   58.201576 119.89384
 156.58505   98.59373   46.404278  80.04506  163.35693   73.77315
  ...
  85.225655  71.46049  265.62012   65.11302   66.18507   55.80021
  57.64439   47.538292  52.368004]
Display result
We want to see clearly our predictions.
# create data frame and display it
result = pd.DataFrame(data={"Prediction": predictions})
result
| Prediction | |
|---|---|
| 0 | 45.981655 |
| 1 | 180.340073 |
| 2 | 48.469440 |
| 3 | 188.924088 |
| 4 | 58.201576 |
| ... | ... |
| 982 | 66.185066 |
| 983 | 55.800209 |
| 984 | 57.644390 |
| 985 | 47.538292 |
| 986 | 52.368004 |
987 rows × 1 columns
Conlusions
MLJAR AutoML provides a number of benefits for optimizing and comprehending energy consumption trends when used for energy usage forecasting. MLJAR AutoML improves the accuracy of energy consumption estimates and offers more profound insights into the variables influencing energy usage by automating the difficult procedures of data analysis and model creation. Large datasets may be handled effectively because to this sophisticated automation, which also highlights patterns and abnormalities that conventional approaches can miss. By providing more accurate forecasts and useful insights, MLJAR AutoML has the potential to enhance operational efficiency, promote sustainable energy practices, and drive more successful energy strategies as it becomes more integrated into energy management procedures.
See you soon👋.