How to create Dashboard in Python from PostgreSQL
Accessing database in a terminal is not the best solution for everyone. Many times, we would like to share data in a more accessible way, for example as a web app with interactive dashboard. However, bulding a dashboard from scratch might be hard and might require using many different technologies. Don't worry. There is an easy way to solve this problem with Python only. In this article, you will learn a Pythonic way on how to:
- connect with your PostgreSQL database,
- send SQL queries from Python,
- fetch results from PostgreSQL as Python variables,
- create an interactive dashboard with Python only,
- deploy a dashboard as web app.
Are you curious? Let's start!
Required libraries
We will need few packages to connect database world with Python. Let's walk through required libraries:
import os
os allows you to do basic system operations.
import psycopg2 as ps
Thanks to psycopg2, you will connect with your database. Why not sqlalchemy? Because our choice is a way faster :)
import pandas as pd
pandas allows you to do operations in your database.
import mercury as mr
mercury gives you access to its widgets.
from dotenv import load_dotenv
You will use it to store secret variables needed for database connection.
import altair as alt
altair is amazing for creating plots.
Entering to the Database
The most important thing is to keep your database credentials safe.
In this example, we will use dotenv method, but if you would like to learn more, read the article on how to keep credentials secret in Python Notebook.
Create a file where you put host, port, user, password and name of your database as variables:
# .env file
DB_HOST=your-host
DB_PORT=your-port
DB_USERNAME=your-username
DB_PASSWORD=your-password
DB_DATABASE=your-database
Then you have to load them into your Python script, use the following command:
load_dotenv()
Next, let's create a function which convert your login data into readable for database connection string:
def db_engine():
    host = os.environ.get("DB_HOST")
    port = os.environ.get("DB_PORT")
    user = os.environ.get("DB_USERNAME")
    password = os.environ.get("DB_PASSWORD")
    db = os.environ.get("DB_DATABASE")

    return f"user='{user}' password='{password}' host='{host}' port='{port}' dbname='{db}'"
os.environ.get allows you to access environment variables from .env file. At the end of the function, there is a return with fstring which is connection string for database.
Then connect with your database, you can use a try block to detect possible errors.
try:
    conn = ps.connect(db_engine())
except Exception as e:
    print(f"problems: {e}")
Sending queries and getting responses
Create a query using SQL, but before you send it while running your code, check if it works in your terminal. You can do it like this:
- connect with your database using this command:
psql -h your_host -p your_port -U your_username -d your_database
Then, if you fill it correctly, the terminal will ask you for a password, and you will be in your database after typing it.
Below are 3 example queries:
select count(*) from auth_user where date_joined >= CURRENT_DATE - INTERVAL '30 days';
select count(*) from auth_user where date_joined >= CURRENT_DATE - INTERVAL '7 days';
select date_joined::date, count(*) from auth_user where date_joined >= CURRENT_DATE - INTERVAL '30 days' group by date_joined::dateorder by date_joined;
After you check if they work, implement them in your code. Save them as variables, but you have to set them between apostrophes.
query_1 = "select count(*) from auth_user where date_joined >= CURRENT_DATE - INTERVAL '30 days';"
query_2 = "select count(*) from auth_user where date_joined >= CURRENT_DATE - INTERVAL '7 days';"
query_3 = "select date_joined::date, count(*) from auth_user where date_joined >= CURRENT_DATE - INTERVAL '30 days' group by date_joined::date order by date_joined;"
When you have prepared your queries, it's time to send them. You can do this by updating your code in the try block
try:
    conn = ps.connect(db_engine())
    cur = conn.cursor()
    cur.execute(query_1)
    result_1 = cur.fetchall()
    cur.execute(query_2)
    result_2 = cur.fetchall()
    cur.execute(query_3)
    result_3 = cur.fetchall()
except Exception as e:
    print(f"problems: {e}")
cur = conn.cursor()creates a cursor that allows your program to move around your database.cur.execute()sends your query.cur.fetchall()gets a response for your query.
Converting data into Dashboard
At the beginning, add a headline using mercury function Markdown,
mr.Markdown(text = """# New Accounts:""")
Then you have to create "boxes". There is a mercury widget NumberBox which helps you with it,
boxes = mr.NumberBox([
        mr.NumberBox(data = result_1[0][0], title = "30 days"),
        mr.NumberBox(data = result_2[0][0], title = "7 days")
    ])
- [0][0] after
result_1andresult_2is addres of cell in the table.
You can get more information about this widget in NumberBox documentation.
The last step is creating a plot, which will be more challenging than headlines or boxes. This was a different type of query, so the result is different, too. If you type result_3, it will show this:
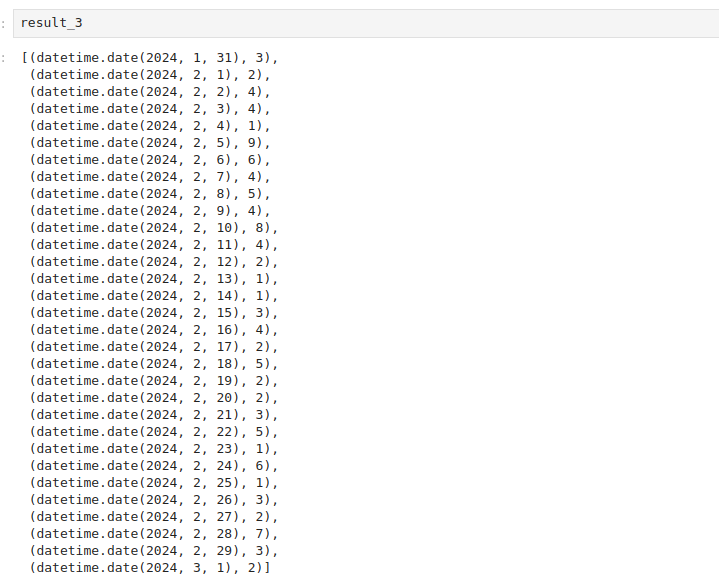 But don't worry, we got you ;)
df = pd.DataFrame(result_3, columns=['Date', 'Count'])
df['Date']=df['Date'].apply(lambda x: str(x))
fig = alt.Chart(df).mark_bar().encode(
    x='Date',
    y='Count',
    tooltip=['Date', 'Count']
).properties(
    width="container"
)
First, use DataFrame from pandas to create a table and name your columns. Then, appeal to the column with the date and transfer it to the string using lambda. Next, create a plot using altair and set your x and `y' axes; you can also add a tooltip (only with columns' names), and using properties, you can set the width of a plot to adapt the screen width.
Display in Jupyter Notebook
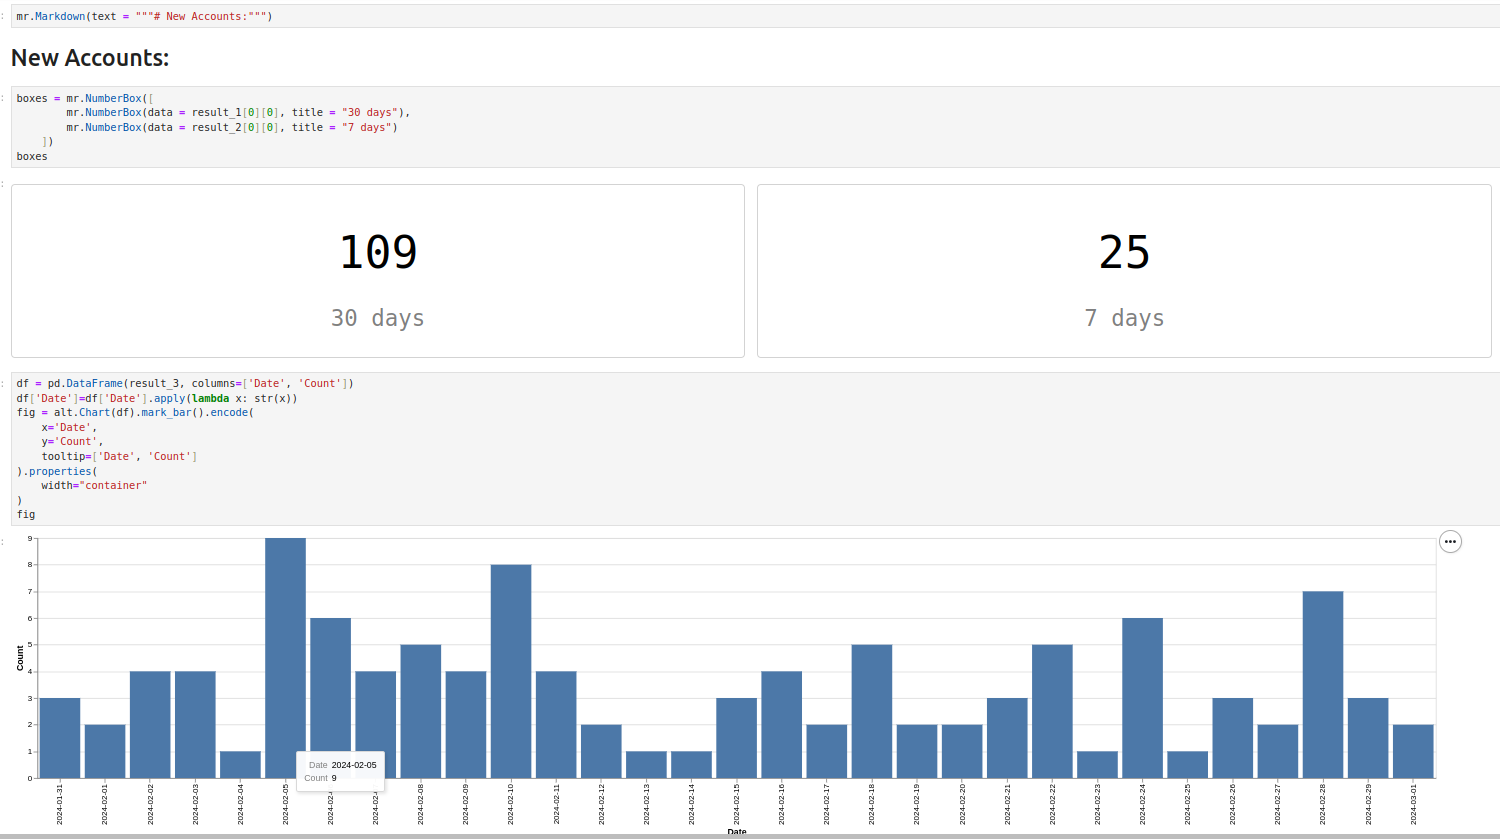
It doesn't look as good as you expected, right? There is an option to make it a way better.
Uploading Dashboard form Notebook to WebApp
First, you must sign up in Mercury Cloud. Then, create a new site and upload your Notebook. After that, it should look like this:
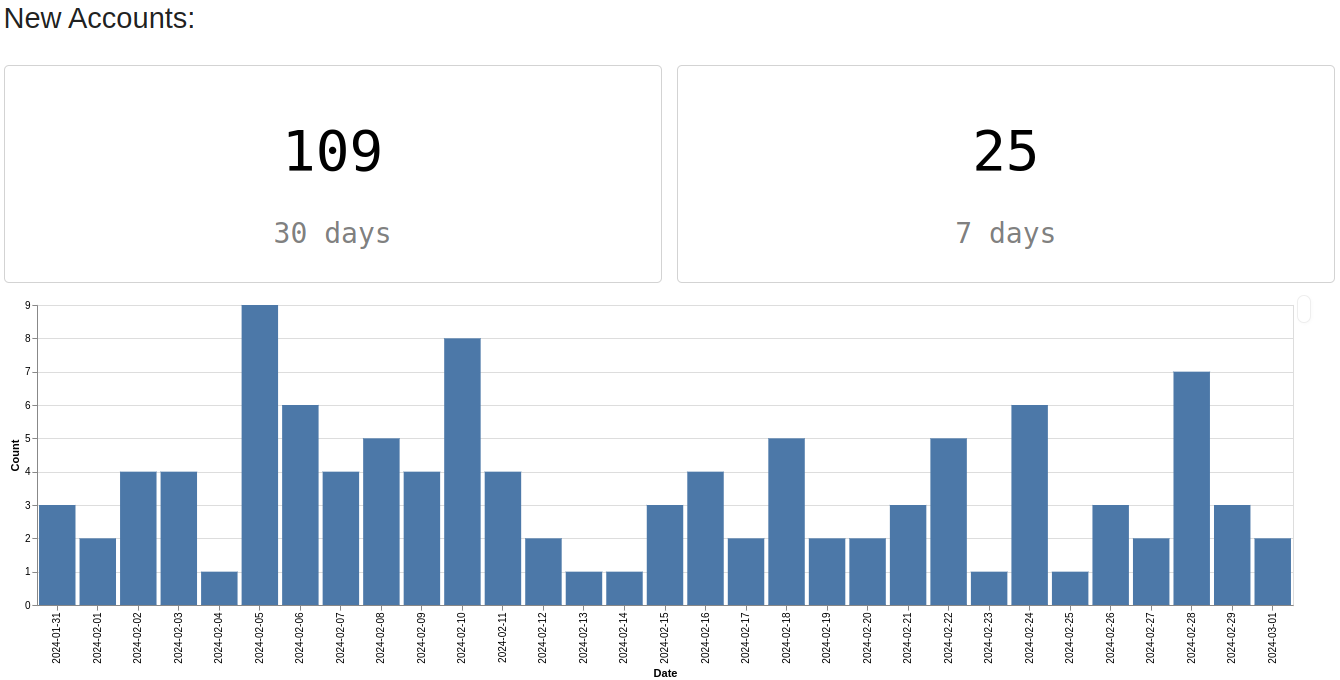
If you have any problems with it, check Mercury Documentation.
Summary
Congrats! Now, you can convert PostgreSQL data into a dashboard with Python only. Dashboard is deployed as a web application and can be easily shared with non-technical users. Try to do the same thing with your data and share your results or give us feedback.
AI Data Analyst on Your Computer
Use MLJAR Studio to explore data, find insights, and create reports with AI. Everything runs locally, so your data stays with you.
About the Authors


Related Articles
- 9 ways to set colors in Matplotlib
- Jupyter Notebook in 4 flavors
- Python Dashboard for 15,963 Data Analyst job listings
- Fairness in Automated Machine Learning
- 3 ways to access credentials in Jupyter Notebook
- How to create Invoice Generator in Python
- ChatGPT can talk with all my Python notebooks
- Create Retrieval-Augmented Generation using OpenAI API
- Transfer data from Postgresql to Google Sheets
- Machine Learning Algorithm Comparison