9 ways to set colors in Matplotlib
Matplotlib is a powerful visualization package for Python. It is very customizable, thanks to this it is widly used in commercial and in academic use cases. In this article, I will show you 9 different ways how to set colors in Matplotlib plots. All parts of the plot can be customized with a new color. You can set colors for axes, labels, background, title. However, not every data scientist is a graphic designer that can compose nice looking colors in a single plot, so I can show you how to use predefined Matplotlib styles to get attractive plots.
1. Define color as RGB/RGBA float touple
The first method to define a color in a Matplotlib is to use RGB (red, green, blue) or RGBA (red, green, blue, alpha) touple of floats. The numbers should be in range [0, 1]. Each number in the touple controls how many of base color will be in final color. For example (1, 0, 0) is red color because there is 0 of green and blue. The alpha parameter in RGBA controls transparency. It is useful when we have overlaping elements in the plot.
Below is a minimal example of how to set color in the plot. We simply pass color parameter in the plot function with touple:
plt.plot(data, color=(0,1,0))
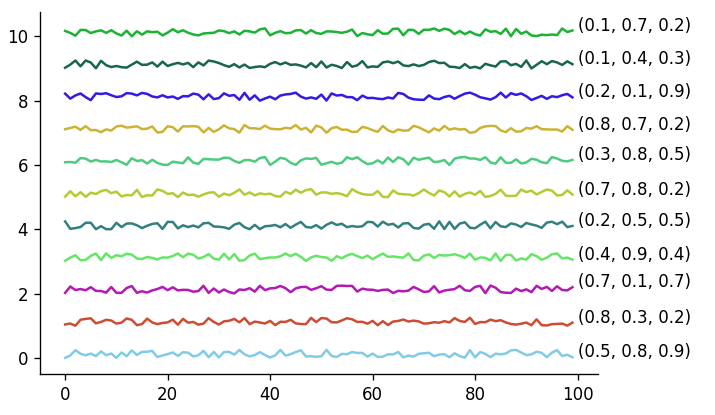
Plot with several colors is presented below. RGB colors are randomly generated.
x = np.array(range(100))

fig = plt.figure()
ax = plt.subplot(111)

ax.spines.right.set_visible(False)
ax.spines.top.set_visible(False)

for i in range(11):
    r = np.round(np.random.rand(),1)
    g = np.round(np.random.rand(),1)
    b = np.round(np.random.rand(),1)

    y = i + np.random.rand(100)*0.25
    plt.plot(x, y, color=[r,g,b])
    plt.annotate(f"({r}, {g}, {b})", (100, y[-1]))
Here is an example of histograms with overlaping distributions, we use alpha parameter to visualize them:
np.random.seed(12)
x = np.array(range(100))

fig = plt.figure()
ax = plt.subplot(111)

ax.spines.right.set_visible(False)
ax.spines.top.set_visible(False)

for i in range(4):
    r = np.round(np.random.rand(),1)
    g = np.round(np.random.rand(),1)
    b = np.round(np.random.rand(),1)
    a = np.round(np.clip(np.random.rand(), 0, 1), 1)

    y = i+np.random.normal(i*3, 1.5, (4-i)*100)
    plt.hist(y, color=[r,g,b, a], label=str(np.round(i*0.1, 1)))
    plt.annotate(f"({r}, {g}, {b}, {a})", (i*4, (4-i)*20))

2. Matplotlib color as RGB/RGBA hex
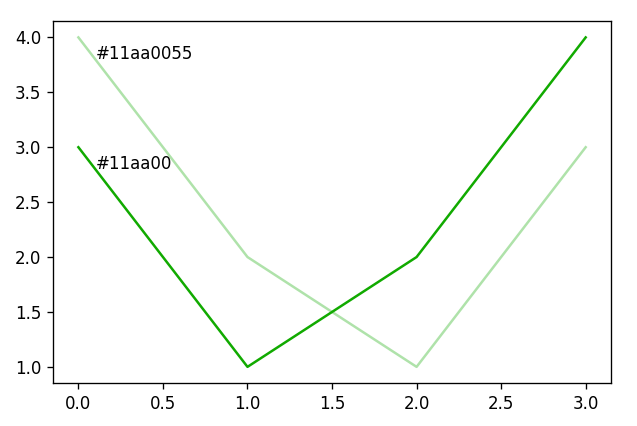
The RGB and RGBA colors can be defined as hex strings, similar to CSS style sheet language. The minimum value is 00 and maximum value is FF. You need to start string with #.
plt.plot([3,1,2,4], color="#11aa00")
plt.plot([4,2,1,3], color="#11aa0055")
plt.annotate(f"#11aa00", (0.1, 2.8))
plt.annotate(f"#11aa0055", (0.1, 3.8))
3. Shorthand RGB/RGBA hex
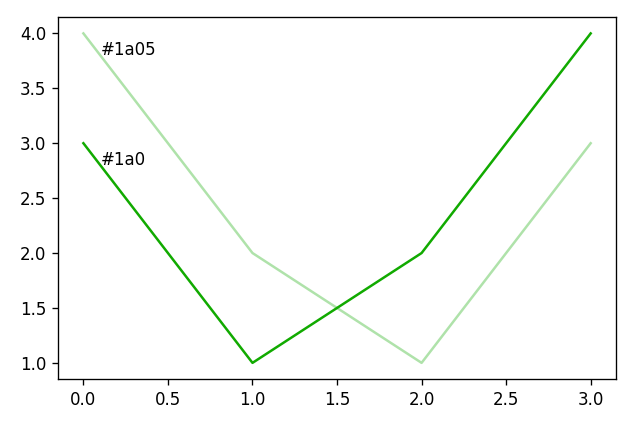
The hex string can be shorted if there are the duplicate values for each channel. For example #11aa00 can be passed as #1a0 and #11aa0055 can be passed as #1a05:
plt.plot([3,1,2,4], color="#1a0")
plt.plot([4,2,1,3], color="#1a05")
plt.annotate(f"#1a0", (0.1, 2.8))
plt.annotate(f"#1a05", (0.1, 3.8))
Please remember, that if you are using shorthand hex, then it should be applied to all channels.
4. Gray scale
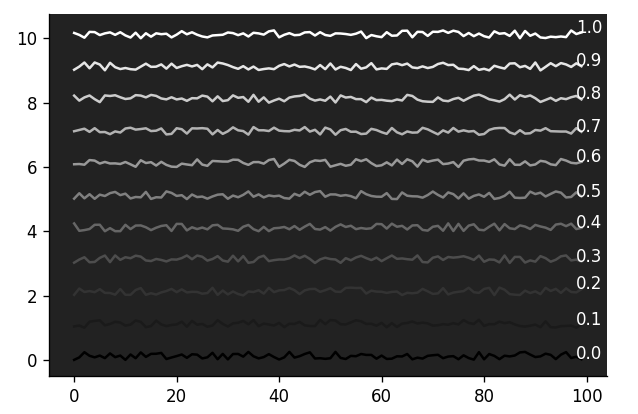
You can define a color as a gray scale by passing a string representation of float number from range [0,1]. Please remember that the float needs to be passed as a string. Below is an example of gray scale colors:
np.random.seed(14)
x = np.array(range(100))
fig = plt.figure()
ax = plt.subplot(111)
ax.set_facecolor('#222')
ax.spines.right.set_visible(False)
ax.spines.top.set_visible(False)

for i in range(11):
    r = np.round(np.random.rand(),1)
    g = np.round(np.random.rand(),1)
    b = np.round(np.random.rand(),1)

    y = i + np.random.rand(100)*0.25
    plt.plot(x,  y, color=f"{i/10}")
    plt.annotate(f"{i/10}", (100-2, y[-1]), color="w")
5. Single letter string
Matplotlib package has implementation of several sets of named colors. The first type of named colors are single letter colors. You can list them with the following code:
import matplotlib.colors as mcolors
print(mcolors.BASE_COLORS)
Output:
{'b': (0, 0, 1),
 'g': (0, 0.5, 0),
 'r': (1, 0, 0),
 'c': (0, 0.75, 0.75),
 'm': (0.75, 0, 0.75),
 'y': (0.75, 0.75, 0),
 'k': (0, 0, 0),
 'w': (1, 1, 1)}
Below is an example that is using all single letter colors:
colors = ['b', 'g', 'r', 'c', 'm', 'y', 'k', 'w']

np.random.seed(14)
x = np.array(range(100))
fig = plt.figure()
ax = plt.subplot(111)
ax.set_facecolor('#333')
ax.spines.right.set_visible(False)
ax.spines.top.set_visible(False)

for i in range(8):
    r = np.round(np.random.rand(),1)
    g = np.round(np.random.rand(),1)
    b = np.round(np.random.rand(),1)

    y = i + np.random.rand(100)*0.25
    plt.plot(x,  y, color=colors[i])
    plt.annotate(f"{colors[i]}", (100, y[-1]), color="w")

6. X11/CSS color names
The next set of named colors comes from X11 list. Those are the same color names as used in CSS styling language (from web development). There are 148 color names available. You can list them with the following command:
import matplotlib.colors as mcolors
print(mcolors.CSS4_COLORS)
You can check their visualization in Matplotlib documentation or in Wikipedia article about X11 colors.
Example color names:
print(mcolors.CSS4_COLORS)

>>> { 'aliceblue': '#F0F8FF',
      'antiquewhite': '#FAEBD7',
      'aqua': '#00FFFF',
      'aquamarine': '#7FFFD4',
      'azure': '#F0FFFF',
      'beige': '#F5F5DC',
      'bisque': '#FFE4C4',
      ...
7. XKCD color names
The XKCD is a website with comics, run by Randall Munroe. He made a survey about most used RGB colors anc compiled them into the list. There are 949 colors available in the Matplotlib package. You can list XKCD colors with the following command:
import matplotlib.colors as mcolors
print(mcolors.XKCD_COLORS)

>>> { 'xkcd:cloudy blue': '#acc2d9',
      'xkcd:dark pastel green': '#56ae57',
      'xkcd:dust': '#b2996e',
      'xkcd:electric lime': '#a8ff04',
      'xkcd:fresh green': '#69d84f',
      'xkcd:light eggplant': '#894585',
      'xkcd:nasty green': '#70b23f',
      ...
Please check the XKCD website to check all color names.
8. Cycler colors
There is colors cycler available in the Matplotlib. It define a list of colors that by default are used in the plot. The are used in the cycle. You can list them with following command:
print(plt.rcParams["axes.prop_cycle"])

>>> cycler('color', ['#1f77b4', '#ff7f0e', '#2ca02c', '#d62728', '#9467bd', '#8c564b', '#e377c2', '#7f7f7f', '#bcbd22', '#17becf'])
You can observe color cycle by ploting several lines in the chart without specifying the color:
x = np.array(range(10))

for i in range(30):
    plt.plot(x, i+x)

You can access the cycler colors by string "Cx", where x is a color index in the list. For example to get first color from the cycler list you will use color="C0" - counting starts from 0 :-)
9. Tableau colors
The last set of named colors is from Tableau palette. You can access them with the following code:
print(mcolors.TABLEAU_COLORS)

>>> { 'tab:blue': '#1f77b4',
      'tab:orange': '#ff7f0e',
      'tab:green': '#2ca02c',
      'tab:red': '#d62728',
      'tab:purple': '#9467bd',
      'tab:brown': '#8c564b',
      'tab:pink': '#e377c2',
      'tab:gray': '#7f7f7f',
      'tab:olive': '#bcbd22',
      'tab:cyan': '#17becf'}
Customize colors in the Matplotlib chart
You can set a new color to any part of the Matplotlib chart. Let's take a default view for very simple plot:
plt.plot([1,3,2,4])

We can change the background color outside the plot and inside the plot:
fig, ax = plt.subplots(facecolor="red")
ax.set_facecolor(color="green")
ax.plot([1,3,2,4], color="C1")

We can change colors for title, labels, and ticks:
fig, ax = plt.subplots(facecolor="gray")
ax.set_facecolor(color="azure")
ax.set_title("Title", color="aqua")
ax.set_xlabel("X Label", color="magenta")
ax.set_ylabel('Y Label', color="orange")
ax.tick_params(labelcolor='red')
ax.plot([1,3,2,4])

Predefined Matplotlib styles
There predefined styles in Matplotlib so you don't need to worry which colors to select. Each style defines background color, text color and new cycles colors. It is a complete set of colors. You can list all available styles with the following code:
print(plt.style.available)

>>> [ 'Solarize_Light2',
      '_classic_test_patch',
      '_mpl-gallery',
      '_mpl-gallery-nogrid',
      'bmh',
      'classic',
      'dark_background',
      'fast',
      'fivethirtyeight',
      'ggplot',
      'grayscale',
      'seaborn-v0_8',
      'seaborn-v0_8-bright',
      'seaborn-v0_8-colorblind',
      'seaborn-v0_8-dark',
      'seaborn-v0_8-dark-palette',
      'seaborn-v0_8-darkgrid',
      'seaborn-v0_8-deep',
      'seaborn-v0_8-muted',
      'seaborn-v0_8-notebook',
      'seaborn-v0_8-paper',
      'seaborn-v0_8-pastel',
      'seaborn-v0_8-poster',
      'seaborn-v0_8-talk',
      'seaborn-v0_8-ticks',
      'seaborn-v0_8-white',
      'seaborn-v0_8-whitegrid',
      'tableau-colorblind10']
You can set the style globally for all plots:
plt.style.use("ggplot")
or you can set style just for single plot:
with plt.style.context("ggplot"):
    plt.plot([1,2,3])
I've plotted all styles below with lines plot:
x = np.array(range(10))
fig = plt.figure(figsize=(10, 20), tight_layout=True)

for i, style in enumerate(['default'] + plt.style.available):
    with plt.style.context(style):
        ax = fig.add_subplot(10, 3, i + 1)
        for i in range(10):
            y = i + np.random.rand(10)*0.25
            ax.plot(x,  y)

    if style == "dark_background":
        ax.set_title(style, color="k")
    else:
        ax.set_title(style)

All styles with histograms:
fig = plt.figure(figsize=(10, 20), tight_layout=True)

for i, style in enumerate(['default'] + plt.style.available):
    with plt.style.context(style):
        ax = fig.add_subplot(10, 3, i + 1)
        for i in range(4):
            y = i+np.random.normal(i*3, 1.5, (4-i)*100)
            ax.hist(y)

    if style == "dark_background":
        ax.set_title(style, color="k")
    else:
        ax.set_title(style)

Summary
Matplotlib is a perfect library for scientific and commercial visualizations. It is highly customizable. There are 9 ways to set a new color. You can change color for every part of the plot. There are many predefined styles available in the package, that can help you to create attractive charts.
AI Data Analyst on Your Computer
Use MLJAR Studio to explore data, find insights, and create reports with AI. Everything runs locally, so your data stays with you.
About the Authors


Related Articles
- The 2 ways to save and load scikit-learn model
- Complete list of 594 PyTZ timezones
- Save a Plot to a File in Matplotlib (using 14 formats)
- Convert Jupyter Notebook to Python script in 3 ways
- 3 ways to get Pandas DataFrame row count
- Jupyter Notebook in 4 flavors
- Python Dashboard for 15,963 Data Analyst job listings
- Fairness in Automated Machine Learning
- 3 ways to access credentials in Jupyter Notebook
- How to create Dashboard in Python from PostgreSQL